Xerox 2013 Annual Report Download - page 11
Download and view the complete annual report
Please find page 11 of the 2013 Xerox annual report below. You can navigate through the pages in the report by either clicking on the pages listed below, or by using the keyword search tool below to find specific information within the annual report.-
 1
1 -
 2
2 -
 3
3 -
 4
4 -
 5
5 -
 6
6 -
 7
7 -
 8
8 -
 9
9 -
 10
10 -
 11
11 -
 12
12 -
 13
13 -
 14
14 -
 15
15 -
 16
16 -
 17
17 -
 18
18 -
 19
19 -
 20
20 -
 21
21 -
 22
22 -
23
-
24
-
25
-
26
-
27
-
28
-
29
-
30
-
31
-
32
-
33
-
34
-
35
-
36
-
37
-
38
-
39
-
40
-
41
-
42
-
43
-
44
-
45
-
46
-
47
-
48
-
49
-
50
-
51
-
52
-
53
-
54
-
55
-
56
-
57
-
58
-
59
-
60
-
61
-
62
-
63
-
64
-
65
-
66
-
67
-
68
-
69
-
70
-
71
-
72
-
73
-
74
-
75
-
76
-
77
-
78
-
79
-
80
-
81
-
82
-
83
-
84
-
85
-
86
-
87
-
88
-
89
-
90
-
91
-
92
-
93
-
94
-
95
-
96
-
97
-
98
-
99
-
100
-
101
-
102
-
103
-
104
-
105
-
106
-
107
-
108
-
109
-
110
-
111
-
112
-
113
-
114
-
115
-
116
-
117
-
118
-
119
-
120
-
121
-
122
-
123
-
124
-
125
-
126
-
127
-
128
-
129
-
130
-
131
-
132
-
133
-
134
-
135
-
136
-
137
-
138
-
139
-
140
-
141
-
142
-
143
-
144
-
145
-
146
-
147
-
148
-
149
-
150
-
151
-
152
 |
 |

9
Xerox 2013 Annual Report
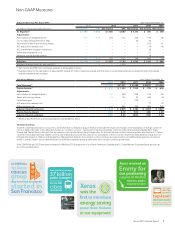
Non-GAAP Measures
was the
top-level
to be registered with the U.S.
Department of Defense
xerox.com
seventh
domain name
xerox.com
1st Xerox
group
(Bay Area Black Employees)
In 1969 the
caucus
San Francisco
started in
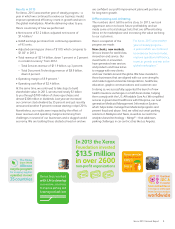
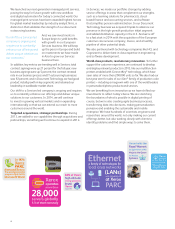
Every year Xerox manages
public transport
transactions
worldwide
across 400
cities
37 billion
Xerox
energy saving
in our equipment
first to introduce
power-down features
was the
Xerox received an
Emmy for
our pioneering
support of the first
electronic graphic
creative system
Xerox received an
Emmy for
our pioneering
support of the first
electronic graphic
creative system
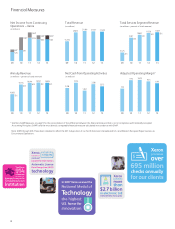
Adjusted Earnings Per Share (EPS) Year Ended December 31,
2013 2012 2011 2010 2009
(in millions; except per share amounts) Net Income EPS Net Income EPS Net Income Net Income Net Income
As Reported(1) $ 1,185 $ 0.93 $ 1,184 $ 0.87 $ 1,274 $ 591 $ 478
Adjustments:
Amortization of intangible assets 205 0.16 203 0.15 248 194 38
Loss on early extinguishment of debt – – – – 20 10 –
Xerox and Fuji Xerox restructuring charge – – – – – 355 41
ACS acquisition-related costs – – – – – 58 49
ACS shareholders’ litigation settlement – – – – – 36 –
Venezuela devaluation costs – – – – – 21 –
Medicare subsidy tax law change – – – – – 16 –
205 0.16 203 0.15 268 690 128
Adjusted $ 1,390 $ 1.09 $ 1,387 $ 1.02 $ 1,542 $ 1,281 $ 606
Weighted average shares for adjusted EPS(2) 1,274 1,356
(1)
Net income and EPS from continuing operations attributable to Xerox.
(2)
Average shares for the calculation of adjusted EPS include 27 million shares associated with the Series A convertible preferred stock and therefore the related
quarterly dividend was excluded.
Operating Margin (in millions) Year Ended December 31,
2013 2012 2011 2010 2009
Total Revenues(1) $ 21,435 $ 21,737 $ 21,900 $ 20,872 $ 14,376
Pre-tax Income(1) $ 1,312 $ 1,332 $ 1,535 $ 793 $ 616
Adjustments:
Amortization of intangible assets 332 328 398 312 60
Xerox restructuring charge 116 154 32 483 (8)
Curtailment gain – – (107) – –
ACS acquisition-related costs –– – 77 72
Other expenses, net 150 261 326 392 289
Adjusted Operating Income $ 1,910 $ 2,075 $ 2,184 $ 2,057 $ 1,029
Pre-tax Income Margin 6.1% 6.1% 7.0% 3.8% 4.3%
Adjusted Operating Margin 8.9% 9.5% 10.0% 9.9% 7.2%
(1) Revenue and Profit from continuing operations attributable to Xerox.
Constant Currency
To better understand trends in our business, we believe that it is helpful to adjust revenue to exclude the impact of changes in the translation of foreign currencies
into U.S. dollars. We refer to this adjusted revenue as “constant currency.” Currencies for developing market countries (Latin America, Brazil, Middle East, India,
Eurasia and Central-Eastern Europe) that we operate in are reported at actual exchange rates for both actual and constant revenue growth rates because (1) these
countries historically have had volatile currency and inflationary environments and (2) our subsidiaries in these countries have historically taken pricing actions to
mitigate the impact of inflation and devaluation. Management believes the constant currency measure provides investors an additional perspective on revenue
trends. Currency impact can be determined as the difference between actual growth rates and constant currency growth rates.
Note: 2009 through 2012 have been restated to reflect the 2013 disposition of our North American (Canada and U.S.) and Western European Paper business as
Discontinued Operations.