Xerox 2013 Annual Report Download - page 45
Download and view the complete annual report
Please find page 45 of the 2013 Xerox annual report below. You can navigate through the pages in the report by either clicking on the pages listed below, or by using the keyword search tool below to find specific information within the annual report.-
 1
1 -
2
-
3
-
4
-
5
-
6
-
7
-
8
-
9
-
10
-
11
-
12
-
13
-
14
-
15
-
16
-
17
-
18
-
19
-
20
-
21
-
22
-
23
-
24
-
25
-
26
-
27
-
28
-
29
-
30
-
31
-
32
-
33
-
34
-
 35
35 -
 36
36 -
 37
37 -
 38
38 -
 39
39 -
 40
40 -
 41
41 -
 42
42 -
 43
43 -
 44
44 -
 45
45 -
 46
46 -
 47
47 -
 48
48 -
 49
49 -
 50
50 -
 51
51 -
 52
52 -
 53
53 -
 54
54 -
 55
55 -
56
-
57
-
58
-
59
-
60
-
61
-
62
-
63
-
64
-
65
-
66
-
67
-
68
-
69
-
70
-
71
-
72
-
73
-
74
-
75
-
76
-
77
-
78
-
79
-
80
-
81
-
82
-
83
-
84
-
85
-
86
-
87
-
88
-
89
-
90
-
91
-
92
-
93
-
94
-
95
-
96
-
97
-
98
-
99
-
100
-
101
-
102
-
103
-
104
-
105
-
106
-
107
-
108
-
109
-
110
-
111
-
112
-
113
-
114
-
115
-
116
-
117
-
118
-
119
-
120
-
121
-
122
-
123
-
124
-
125
-
126
-
127
-
128
-
129
-
130
-
131
-
132
-
133
-
134
-
135
-
136
-
137
-
138
-
139
-
140
-
141
-
142
-
143
-
144
-
145
-
146
-
147
-
148
-
149
-
150
-
151
-
152
 |
 |
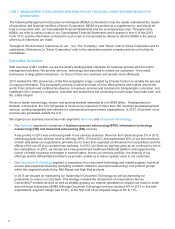
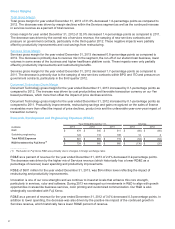
Annuity-Based Business Model
In 2013, 84 percent of our total revenue was annuity-based, which includes contracted services, equipment
maintenance, consumable supplies and financing, among other elements. Our annuity revenue significantly benefits
from growth in Services. Some of the key indicators of annuity revenue growth include:
• Services business signings, which reflects the estimated future revenues from contracts signed during the
period.
• Services renewal rate, which is defined as the annual recurring revenue (ARR) on contracts that are renewed
during the period, calculated as a percentage of ARR on all contracts where a renewal decision was made
during the period.
• Services pipeline growth, which measures the increase in new business opportunities.
• Installations of printers and multifunction printers as well as the number of machines in the field (MIF) and the
page volume and mix of pages printed on color devices, where available.
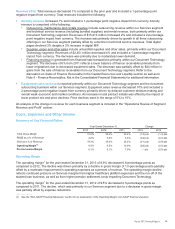
Acquisitions
Consistent with our strategy to expand our Services offerings and expand and strengthen our product portfolio and
distribution capabilities in Document Technology, we completed several acquisitions during 2013. Refer to
Acquisitions and Divestitures in Item 1. Business in this Form 10-K as well as Note 3 - Acquisitions and Divestitures
in our Consolidated Financial Statements for additional information regarding our 2013 acquisitions.
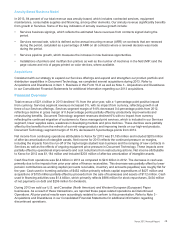
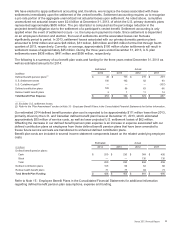
Financial Overview
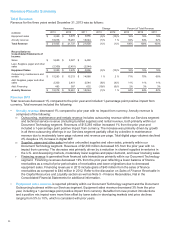
Total revenue of $21.4 billion in 2013 declined 1% from the prior year, with a 1-percentage point positive impact
from currency. Services segment revenues increased 3%, with no impact from currency, reflecting growth in all
three of our Services offerings. Services segment margin of 9.8% decreased 0.4-percentage points from 2012,
reflecting a decline in gross margin of 0.8-percentage points partially offset by productivity improvements and
restructuring benefits. Document Technology segment revenues declined 6% with no impact from currency
reflecting the continued migration of customers to Xerox managed print services, which is included in our Services
segment, lower supplies sales, weakness in developing markets and price declines. These declines were partially
offset by the benefits from the refresh of our mid-range products and improving trends on our high-end products.
Document Technology segment margin of 10.8% decreased 0.5-percentage points from 2012.
Net income from continuing operations attributable to Xerox for 2013 was $1,185 million and included $205 million
of after-tax amortization of intangible assets. Net income for 2013 reflects the continued pressure on margins,
including the impacts from the run-off of the high-margin student loan business and the ramping of new contracts in
Services as well as the effects of ongoing equipment price pressure in Document Technology. These impacts were
partially offset by operational improvements and cost reductions from restructuring actions. Net income attributable
to Xerox for 2012 was $1,184 million and included $203 million of after-tax amortization of intangible assets.
Cash flow from operations was $2.4 billion in 2013 as compared to $2.6 billion in 2012. The decrease in cash was
primarily due to the impacts from prior year sales of finance receivables. This decrease was partially offset by lower
pension contributions as working capital (accounts receivable, inventory and accounts payables) was roughly flat for
the year. Cash used in investing activities of $452 million primarily reflects capital expenditures of $427 million and
acquisitions of $155 million partially offset by proceeds from the sale of businesses and assets of $112 million. Cash
used in financing activities was $1.4 billion, which primarily reflects $696 million for stock repurchases, $434 million
of net payments on debt and $296 million for dividends.
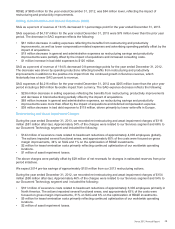
During 2013 we sold our U.S. and Canadian (North American) and Western European (European) Paper
businesses. As a result of these transactions, we reported these paper-related operations as Discontinued
Operations. All prior period results were accordingly restated to conform to this presentation. Refer to Note 3 -
Acquisitions and Divestitures in our Consolidated Financial Statements for additional information regarding
discontinued operations.
Xerox 2013 Annual Report 28