Xerox 2013 Annual Report Download - page 51
Download and view the complete annual report
Please find page 51 of the 2013 Xerox annual report below. You can navigate through the pages in the report by either clicking on the pages listed below, or by using the keyword search tool below to find specific information within the annual report.-
 1
1 -
2
-
3
-
4
-
5
-
6
-
7
-
8
-
9
-
10
-
11
-
12
-
13
-
14
-
15
-
16
-
17
-
18
-
19
-
20
-
21
-
22
-
23
-
24
-
25
-
26
-
27
-
28
-
29
-
30
-
31
-
32
-
33
-
34
-
35
-
36
-
37
-
38
-
39
-
40
-
 41
41 -
 42
42 -
 43
43 -
 44
44 -
 45
45 -
 46
46 -
 47
47 -
 48
48 -
 49
49 -
 50
50 -
 51
51 -
 52
52 -
 53
53 -
 54
54 -
 55
55 -
 56
56 -
 57
57 -
 58
58 -
 59
59 -
 60
60 -
 61
61 -
62
-
63
-
64
-
65
-
66
-
67
-
68
-
69
-
70
-
71
-
72
-
73
-
74
-
75
-
76
-
77
-
78
-
79
-
80
-
81
-
82
-
83
-
84
-
85
-
86
-
87
-
88
-
89
-
90
-
91
-
92
-
93
-
94
-
95
-
96
-
97
-
98
-
99
-
100
-
101
-
102
-
103
-
104
-
105
-
106
-
107
-
108
-
109
-
110
-
111
-
112
-
113
-
114
-
115
-
116
-
117
-
118
-
119
-
120
-
121
-
122
-
123
-
124
-
125
-
126
-
127
-
128
-
129
-
130
-
131
-
132
-
133
-
134
-
135
-
136
-
137
-
138
-
139
-
140
-
141
-
142
-
143
-
144
-
145
-
146
-
147
-
148
-
149
-
150
-
151
-
152
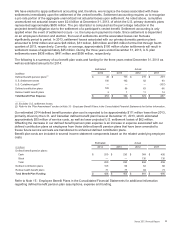
 |
 |

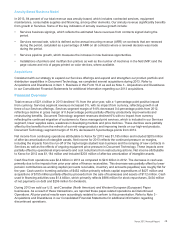
When performing our discounted cash flow analysis for each reporting unit, we incorporate the use of projected
financial information and discount rates that are developed using market participant-based assumptions. The cash-
flow projections are based on three-year financial forecasts developed by management that include revenue and
expense projections, capital spending trends, and investment in working capital to support anticipated revenue
growth or other changes in the business. The selected discount rates consider the risk and nature of the respective
reporting units' cash flows and an appropriate capital structure and rates of return that market participants would
require to invest their capital in our reporting units.
In performing our 2013 impairment test, the following were the 3-year assumptions for Document Technology and
the four reporting units within our Services segment with respect to revenue, operating income and margins, which
formed the basis for estimating future cash flows used in the discounted cash flow model:
• Document Technology - revenue decline: 2%-3% - with higher declines in 2014 and moderating in 2015-2016,
operating income growth: flat-1%, and operating margin: 10%-11% - as we continue to manage costs as a
result of an expected decline in revenues.
• Services - revenue growth: 5%-6%, operating income growth: 9%-12%, and operating margin: 10%-12% - as
we benefit from recurring revenue and prior year signings while improving the mix of services and restructuring
the businesses to achieve operating margin growth.
We believe these assumptions are appropriate because they are consistent with historical results as well as our
forecasted long-term business model and give appropriate consideration to the current economic environment and
markets that we serve. The average discount rate applied to our projected cash flows was approximately 10%,
which we considered reasonable based on the estimated capital costs of applicable market participants. Although
the sum of the fair values of our reporting units was in excess of our market capitalization, we believe the difference
is reasonable when market-based control premiums and other factors are taken into consideration, including the
evolution of our business to be predominantly services-based.
When performing our market approach for each reporting unit, we rely specifically on the guideline public company
method. Our guideline public company method incorporates revenues and earnings multiples from publicly traded
companies with operations and other characteristics similar to each reporting unit. The selected multiples consider
each reporting unit’s relative growth, profitability, size and risk relative to the selected publicly traded companies.
After completing our annual impairment reviews for each reporting unit in the fourth quarter of 2013 and 2012, we
concluded that goodwill was not impaired in either of these years. In 2013, no reporting unit had an excess of fair
value over carrying value of less than 20%. Our impairment assessment methodology includes the use of outside
valuation experts and the inclusion of factors and assumptions related to third-party market participants.
Subsequent to our fourth quarter impairment test, we did not identify any indicators of potential impairment that
required an update to the annual impairment test.
Refer to Note 9 - Goodwill and Intangible Assets, Net in the Consolidated Financial Statements for additional
information regarding goodwill by reportable segment.
Xerox 2013 Annual Report 34