Xerox 2013 Annual Report Download - page 66
Download and view the complete annual report
Please find page 66 of the 2013 Xerox annual report below. You can navigate through the pages in the report by either clicking on the pages listed below, or by using the keyword search tool below to find specific information within the annual report.-
 1
1 -
2
-
3
-
4
-
5
-
6
-
7
-
8
-
9
-
10
-
11
-
12
-
13
-
14
-
15
-
16
-
17
-
18
-
19
-
20
-
21
-
22
-
23
-
24
-
25
-
26
-
27
-
28
-
29
-
30
-
31
-
32
-
33
-
34
-
35
-
36
-
37
-
38
-
39
-
40
-
41
-
42
-
43
-
44
-
45
-
46
-
47
-
48
-
49
-
50
-
51
-
52
-
53
-
54
-
55
-
 56
56 -
 57
57 -
 58
58 -
 59
59 -
 60
60 -
 61
61 -
 62
62 -
 63
63 -
 64
64 -
 65
65 -
 66
66 -
 67
67 -
 68
68 -
 69
69 -
 70
70 -
 71
71 -
 72
72 -
 73
73 -
 74
74 -
 75
75 -
 76
76 -
77
-
78
-
79
-
80
-
81
-
82
-
83
-
84
-
85
-
86
-
87
-
88
-
89
-
90
-
91
-
92
-
93
-
94
-
95
-
96
-
97
-
98
-
99
-
100
-
101
-
102
-
103
-
104
-
105
-
106
-
107
-
108
-
109
-
110
-
111
-
112
-
113
-
114
-
115
-
116
-
117
-
118
-
119
-
120
-
121
-
122
-
123
-
124
-
125
-
126
-
127
-
128
-
129
-
130
-
131
-
132
-
133
-
134
-
135
-
136
-
137
-
138
-
139
-
140
-
141
-
142
-
143
-
144
-
145
-
146
-
147
-
148
-
149
-
150
-
151
-
152
 |
 |
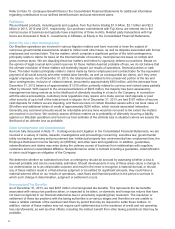
Cash Flows from Operating Activities
Net cash provided by operating activities was $2,375 million for the year ended December 31, 2013. The $205
million decrease in operating cash from 2012 was primarily due to the following:
• $105 million decrease in pre-tax income before net gain on sales of businesses and assets and restructuring.
• $307 million decrease due to lower net run-off of finance receivables of $280 million and higher equipment on
operating leases of $27 million. The lower net run-off of finance receivables was primarily related to the impact
from the receivables sales (see Note 5 - Finance Receivables, Net in the Consolidated Financial Statements for
additional information).
• $149 million decrease due to lower accounts payable and accrued compensation primarily related to the timing
of accounts payable payments.
• $38 million decrease due to higher growth in inventory reflecting the launch of new products.
• $22 million decrease due to the timing of settlements of our foreign currency derivative contracts. These
derivatives primarily relate to hedges of Yen inventory purchases.
• $17 million decrease due to higher net income tax payments.
• $212 million increase from accounts receivable primarily due to lower revenues partially offset by a reduction in
the use of accelerated collection programs such as early pay discounts.
• $134 million increase due to lower contributions to our defined benefit pension plans. This was in line with
expectations.
• $106 million increase from lower spending for product software and up-front costs for outsourcing service
contracts.
Net cash provided by operating activities was $2,580 million for the year ended December 31, 2012. The $619
million increase in cash from 2011 was primarily due to the following:
• $879 million increase from finance receivables primarily due to sales of receivables as well as higher net run-off
of finance receivables as a result of lower equipment sales (see Note 5 - Finance Receivables, Net in the
Consolidated Financial Statements for additional information).
• $124 million increase due to lower inventory growth.
• $74 million increase due to lower restructuring payments.
• $62 million increase due to lower contributions to our defined benefit pension plans primarily in the U.S. as a
result of pension funding legislation enacted in 2012.
• $41 million increase as a result of less up-front costs and other customer related spending associated primarily
with new services contracts.
• $390 million decrease due to a lower benefit from accounts receivable sales as well as growth in services
revenue.
• $45 million decrease from higher net income tax payments primarily due to refunds in the prior year.
In 2012 and 2011, we elected to make contributions of 15.4 million and 16.6 million, respectively, of shares of our
common stock, with an aggregate value of approximately $130 million in each year, to our U.S. defined benefit
pension plan for salaried employees in order to meet our planned level of funding for those years.
Cash Flows from Investing Activities
Net cash used in investing activities was $452 million for the year ended December 31, 2013. The $309 million
decrease in the use of cash from 2012 was primarily due to the following:
• $121 million decrease in acquisitions. 2013 acquisitions include Zeno Office Solutions, Inc. for $59 million,
Impika for $53 million and four smaller acquisitions totaling $43 million. 2012 acquisitions include Wireless Data
for $95 million, RK Dixon for $58 million as well as seven smaller acquisitions totaling $123 million.
• $86 million decrease due to lower capital expenditures (including internal use software).
• $77 million decrease primarily due to $38 million of proceeds from the sale of a U.S. facility and $33 million of
proceeds from the sale of assets to 3D Systems.
• $26 million decrease due to proceeds from the sale of the North American and European Paper businesses.
Net cash used in investing activities was $761 million for the year ended December 31, 2012. The $86 million
increase in the use of cash from 2011 was primarily due to the following:
• $64 million increase in acquisitions. 2012 acquisitions include Wireless Data for $95 million, RK Dixon for $58
million as well as seven smaller acquisitions totaling $123 million. 2011 acquisitions include Unamic/HCN B.V.
for $55 million, ESM for $43 million, Concept Group for $41 million, MBM for $42 million, Breakaway for $18
million and ten smaller acquisitions for an aggregate of $46 million as well as a net cash receipt of $35 million
for Symcor.
• $19 million increase due to lower cash proceeds from asset sales.
49