Xerox 2013 Annual Report Download - page 100
Download and view the complete annual report
Please find page 100 of the 2013 Xerox annual report below. You can navigate through the pages in the report by either clicking on the pages listed below, or by using the keyword search tool below to find specific information within the annual report.-
 1
1 -
2
-
3
-
4
-
5
-
6
-
7
-
8
-
9
-
10
-
11
-
12
-
13
-
14
-
15
-
16
-
17
-
18
-
19
-
20
-
21
-
22
-
23
-
24
-
25
-
26
-
27
-
28
-
29
-
30
-
31
-
32
-
33
-
34
-
35
-
36
-
37
-
38
-
39
-
40
-
41
-
42
-
43
-
44
-
45
-
46
-
47
-
48
-
49
-
50
-
51
-
52
-
53
-
54
-
55
-
56
-
57
-
58
-
59
-
60
-
61
-
62
-
63
-
64
-
65
-
66
-
67
-
68
-
69
-
70
-
71
-
72
-
73
-
74
-
75
-
76
-
77
-
78
-
79
-
80
-
81
-
82
-
83
-
84
-
85
-
86
-
87
-
88
-
89
-
 90
90 -
 91
91 -
 92
92 -
 93
93 -
 94
94 -
 95
95 -
 96
96 -
 97
97 -
 98
98 -
 99
99 -
 100
100 -
 101
101 -
 102
102 -
 103
103 -
 104
104 -
 105
105 -
 106
106 -
 107
107 -
 108
108 -
 109
109 -
 110
110 -
111
-
112
-
113
-
114
-
115
-
116
-
117
-
118
-
119
-
120
-
121
-
122
-
123
-
124
-
125
-
126
-
127
-
128
-
129
-
130
-
131
-
132
-
133
-
134
-
135
-
136
-
137
-
138
-
139
-
140
-
141
-
142
-
143
-
144
-
145
-
146
-
147
-
148
-
149
-
150
-
151
-
152
 |
 |

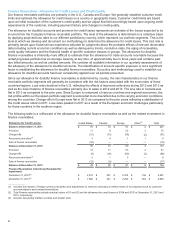
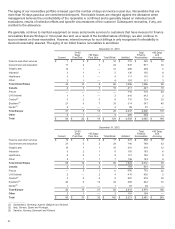
Finance Receivables - Allowance for Credit Losses and Credit Quality
Our finance receivable portfolios are primarily in the U.S., Canada and Europe. We generally establish customer credit
limits and estimate the allowance for credit losses on a country or geographic basis. Customer credit limits are based
upon an initial evaluation of the customer's credit quality and we adjust that limit accordingly based upon ongoing credit
assessments of the customer, including payment history and changes in credit quality.
The allowance for doubtful accounts and provision for credit losses represents an estimate of the losses expected to be
incurred from the Company's finance receivable portfolio. The level of the allowance is determined on a collective basis
by applying projected loss rates to our different portfolios by country, which represent our portfolio segments. This is the
level at which we develop and document our methodology to determine the allowance for credit losses. This loss rate is
primarily based upon historical loss experience adjusted for judgments about the probable effects of relevant observable
data including current economic conditions as well as delinquency trends, resolution rates, the aging of receivables,
credit quality indicators and the financial health of specific customer classes or groups. The allowance for doubtful
finance receivables is inherently more difficult to estimate than the allowance for trade accounts receivable because the
underlying lease portfolio has an average maturity, at any time, of approximately two to three years and contains past
due billed amounts, as well as unbilled amounts. We consider all available information in our quarterly assessments of
the adequacy of the allowance for doubtful accounts. The identification of account-specific exposure is not a significant
factor in establishing the allowance for doubtful finance receivables. Our policy and methodology used to establish our
allowance for doubtful accounts has been consistently applied over all periods presented.
Since our allowance for doubtful finance receivables is determined by country, the risk characteristics in our finance
receivable portfolio segments will generally be consistent with the risk factors associated with the economies of those
countries/regions. Loss rates declined in the U.S. reflecting the effects of improved collections during 2012 and 2013 as
well as the lower balance of finance receivables primarily due to sales in 2012 and 2013. The loss rate in Canada was
flat in 2013 as compared to the prior year. Since Europe is comprised of various countries and regional economies, the
risk profile within our European portfolio segment is somewhat more diversified due to the varying economic conditions
among the countries. Charge-offs in Europe were flat in 2013 as compared to the prior years reflecting a stabilization of
the credit issues noted in 2011. Loss rates peaked in 2011 as a result of the European economic challenges particularly
for those countries in the southern region.
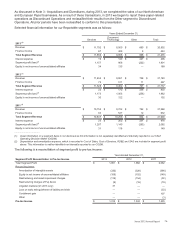
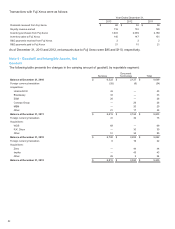
The following table is a rollforward of the allowance for doubtful finance receivables as well as the related investment in
finance receivables:
Allowance for Credit Losses: United States Canada Europe Other(3) Total
Balance at December 31, 2011 $ 75 $ 33 $ 91 $ 2$201
Provision 11 9 52 375
Charge-offs (21)(15)(59) (2) (97)
Recoveries and other(1) 3411 9
Sale of finance receivables (18) — — — (18)
Balance at December 31, 2012 50 31 85 4 170
Provision 13 11 53 481
Charge-offs (8) (16)(60) (2) (86)
Recoveries and other(1) 2 1 3 — 6
Sale of finance receivables (12) (5) — — (17)
Balance at December 31, 2013 $ 45 $ 22 $ 81 $ 6$154
Finance Receivables Collectively Evaluated for
Impairment:
December 31, 2012(2) $2,012 $801 $2,474 $194 $ 5,481
December 31, 2013(2) $1,666 $421 $2,292 $304 $ 4,683
______________
(1) Includes the impacts of foreign currency translation and adjustments to reserves necessary to reflect events of non-payment such as customer
accommodations and contract terminations.
(2) Total Finance receivables exclude residual values of $1 and $2 and the allowance for credit losses of $154 and $170 at December 31, 2013 and
2012, respectively.
(3) Includes developing market countries and smaller units.
83