Xerox 2013 Annual Report Download - page 52
Download and view the complete annual report
Please find page 52 of the 2013 Xerox annual report below. You can navigate through the pages in the report by either clicking on the pages listed below, or by using the keyword search tool below to find specific information within the annual report.-
 1
1 -
2
-
3
-
4
-
5
-
6
-
7
-
8
-
9
-
10
-
11
-
12
-
13
-
14
-
15
-
16
-
17
-
18
-
19
-
20
-
21
-
22
-
23
-
24
-
25
-
26
-
27
-
28
-
29
-
30
-
31
-
32
-
33
-
34
-
35
-
36
-
37
-
38
-
39
-
40
-
41
-
 42
42 -
 43
43 -
 44
44 -
 45
45 -
 46
46 -
 47
47 -
 48
48 -
 49
49 -
 50
50 -
 51
51 -
 52
52 -
 53
53 -
 54
54 -
 55
55 -
 56
56 -
 57
57 -
 58
58 -
 59
59 -
 60
60 -
 61
61 -
 62
62 -
63
-
64
-
65
-
66
-
67
-
68
-
69
-
70
-
71
-
72
-
73
-
74
-
75
-
76
-
77
-
78
-
79
-
80
-
81
-
82
-
83
-
84
-
85
-
86
-
87
-
88
-
89
-
90
-
91
-
92
-
93
-
94
-
95
-
96
-
97
-
98
-
99
-
100
-
101
-
102
-
103
-
104
-
105
-
106
-
107
-
108
-
109
-
110
-
111
-
112
-
113
-
114
-
115
-
116
-
117
-
118
-
119
-
120
-
121
-
122
-
123
-
124
-
125
-
126
-
127
-
128
-
129
-
130
-
131
-
132
-
133
-
134
-
135
-
136
-
137
-
138
-
139
-
140
-
141
-
142
-
143
-
144
-
145
-
146
-
147
-
148
-
149
-
150
-
151
-
152
 |
 |

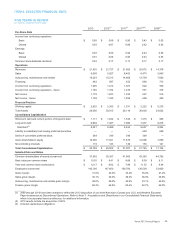
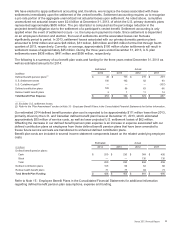
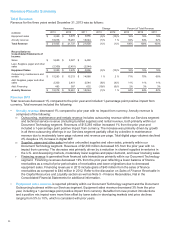
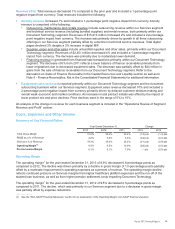
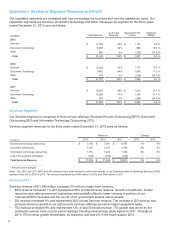
Revenue Results Summary
Total Revenue
Revenue for the three years ended December 31, 2013 was as follows:
Revenues Change Percent of Total Revenue
(in millions) 2013 2012 2011 2013 2012 2013 2012 2011
Equipment sales $ 3,359 $ 3,476 $3,856 (3)% (10)% 16% 16% 18%
Annuity revenue 18,076 18,261 18,044 (1)% 1 % 84% 84% 82%
Total Revenue $ 21,435 $ 21,737 $ 21,900 (1)% (1)% 100%100%100%
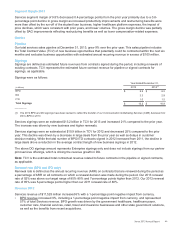
Reconciliation to
Consolidated Statements of
Income:
Sales $ 5,659 $ 5,927 $6,400
Less: Supplies, paper and other
sales (2,300) (2,451) (2,544)
Equipment Sales $ 3,359 $ 3,476 $3,856 (3)% (10)% 16% 16% 18%
Outsourcing, maintenance and
rentals $ 15,293 $ 15,213 $ 14,868 1 % 2 % 71% 70% 68%
Add: Supplies, paper and other
sales 2,300 2,451 2,544 (6)% (4)% 11% 11% 11%
Add: Financing 483 597 632 (19)% (6)% 2% 3% 3%
Annuity Revenue $ 18,076 $ 18,261 $ 18,044 (1)% 1 % 84% 84% 82%
Revenue 2013
Total revenues decreased 1% compared to the prior year and included 1-percentage point positive impact from
currency. Total revenues included the following:
• Annuity revenue decreased 1% compared to prior year with no impact from currency. Annuity revenue is
comprised of the following:
Outsourcing, maintenance and rentals revenue includes outsourcing revenue within our Services segment
and technical service revenue (including bundled supplies) and rental revenue, both primarily within our
Document Technology segment. Revenues of $15,293 million increased 1% from the prior year and
included a 1-percentage point positive impact from currency. The increase was primarily driven by growth
in all three outsourcing offerings in our Services segment partially offset by a decline in maintenance
revenue due to moderately lower page volumes and revenue per page. Total digital page volumes declined
2% despite a 3% increase in digital MIF.
Supplies, paper and other sales includes unbundled supplies and other sales, primarily within our
Document Technology segment. Revenues of $2,300 million decreased 6% from the prior year with no
impact from currency. The decrease was primarily driven by a reduction in channel supplies inventories in
the U.S. and developing markets, moderately lower supplies and paper demand, and lower licensing sales.
Financing revenue is generated from financed sale transactions primarily within our Document Technology
segment. Financing revenues decreased 19% from the prior year reflecting a lower balance of finance
receivables as a result of prior period sales of receivables and lower originations due to decreased
equipment sales. Financing revenues in 2013 include gains of $40 million from the sales of finance
receivables as compared to $44 million in 2012. Refer to the discussion on Sales of Finance Receivable in
the Capital Resources and Liquidity section as well as Note 5 - Finance Receivables, Net in the
Consolidated Financial Statements for additional information.
• Equipment sales revenue is reported primarily within our Document Technology segment and the Document
Outsourcing business within our Services segment. Equipment sales revenue decreased 3% from the prior
year, including a 1-percentage point positive impact from currency. Benefits from new product introductions
and a positive mix impact were more than offset by lower sales in developing markets and price declines
ranging from 5% to 10%, which is consistent with prior years.
35