Xerox 2013 Annual Report Download - page 124
Download and view the complete annual report
Please find page 124 of the 2013 Xerox annual report below. You can navigate through the pages in the report by either clicking on the pages listed below, or by using the keyword search tool below to find specific information within the annual report.-
 1
1 -
2
-
3
-
4
-
5
-
6
-
7
-
8
-
9
-
10
-
11
-
12
-
13
-
14
-
15
-
16
-
17
-
18
-
19
-
20
-
21
-
22
-
23
-
24
-
25
-
26
-
27
-
28
-
29
-
30
-
31
-
32
-
33
-
34
-
35
-
36
-
37
-
38
-
39
-
40
-
41
-
42
-
43
-
44
-
45
-
46
-
47
-
48
-
49
-
50
-
51
-
52
-
53
-
54
-
55
-
56
-
57
-
58
-
59
-
60
-
61
-
62
-
63
-
64
-
65
-
66
-
67
-
68
-
69
-
70
-
71
-
72
-
73
-
74
-
75
-
76
-
77
-
78
-
79
-
80
-
81
-
82
-
83
-
84
-
85
-
86
-
87
-
88
-
89
-
90
-
91
-
92
-
93
-
94
-
95
-
96
-
97
-
98
-
99
-
100
-
101
-
102
-
103
-
104
-
105
-
106
-
107
-
108
-
109
-
110
-
111
-
112
-
113
-
 114
114 -
 115
115 -
 116
116 -
 117
117 -
 118
118 -
 119
119 -
 120
120 -
 121
121 -
 122
122 -
 123
123 -
 124
124 -
 125
125 -
 126
126 -
 127
127 -
 128
128 -
 129
129 -
 130
130 -
 131
131 -
 132
132 -
 133
133 -
 134
134 -
135
-
136
-
137
-
138
-
139
-
140
-
141
-
142
-
143
-
144
-
145
-
146
-
147
-
148
-
149
-
150
-
151
-
152
 |
 |

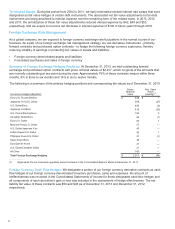
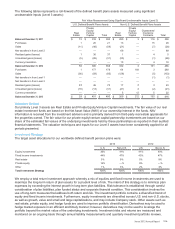
Expected Long-term Rate of Return
We employ a “building block” approach in determining the long-term rate of return for plan assets. Historical markets
are studied and long-term relationships between equities and fixed income are assessed. Current market factors such
as inflation and interest rates are evaluated before long-term capital market assumptions are determined. The long-
term portfolio return is established giving consideration to investment diversification and rebalancing. Peer data and
historical returns are reviewed periodically to assess reasonableness and appropriateness.
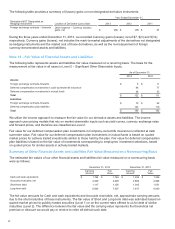
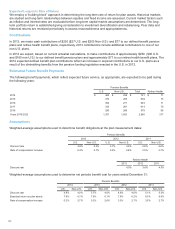
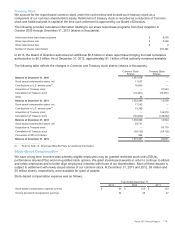
Contributions
In 2013, we made cash contributions of $230 ($27 U.S. and $203 Non-U.S.) and $77 to our defined benefit pension
plans and retiree health benefit plans, respectively. 2013 contributions include additional contributions to one of our
non-U.S. plans.
In 2014 we expect, based on current actuarial calculations, to make contributions of approximately $250 ($90 U.S.
and $160 non-U.S.) to our defined benefit pension plans and approximately $71 to our retiree health benefit plans. The
2014 expected defined benefit plan contributions reflect an increase in required contributions to our U.S. plans as a
result of the diminishing benefits from the pension funding legislation enacted in the U.S. in 2012.
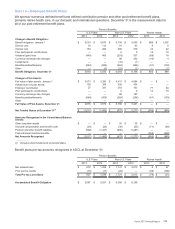
Estimated Future Benefit Payments
The following benefit payments, which reflect expected future service, as appropriate, are expected to be paid during
the following years:
Pension Benefits
U.S. Non-U.S. Total Retiree Health
2014 $ 463 $258 $721 $ 71
2015 374 265 639 73
2016 352 271 623 71
2017 333 281 614 70
2018 290 289 579 69
Years 2019-2022 1,357 1,603 2,960 317
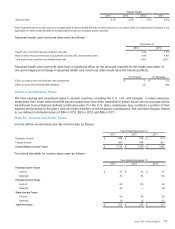
Assumptions
Weighted-average assumptions used to determine benefit obligations at the plan measurement dates:
Pension Benefits
2013 2012 2011
U.S. Non-U.S. U.S. Non-U.S. U.S. Non-U.S.
Discount rate 4.8% 4.2% 3.7% 4.0% 4.8% 4.6%
Rate of compensation increase 0.2% 2.7% 0.2% 2.6% 3.5% 2.7%
Retiree Health
2013 2012 2011
Discount rate 4.5% 3.6% 4.5%
Weighted-average assumptions used to determine net periodic benefit cost for years ended December 31:
Pension Benefits
2014 2013 2012 2011
U.S. Non-U.S. U.S. Non-U.S. U.S. Non-U.S. U.S. Non-U.S.
Discount rate 4.8% 4.2% 3.7% 4.0% 4.8% 4.6% 5.1% 5.3%
Expected return on plan assets 7.8% 6.1% 7.8% 6.1% 7.8% 6.2% 8.3% 6.6%
Rate of compensation increase 0.2% 2.7% 0.2% 2.6% 3.5% 2.7% 3.5% 2.7%
107