Xerox 2013 Annual Report Download - page 56
Download and view the complete annual report
Please find page 56 of the 2013 Xerox annual report below. You can navigate through the pages in the report by either clicking on the pages listed below, or by using the keyword search tool below to find specific information within the annual report.-
 1
1 -
2
-
3
-
4
-
5
-
6
-
7
-
8
-
9
-
10
-
11
-
12
-
13
-
14
-
15
-
16
-
17
-
18
-
19
-
20
-
21
-
22
-
23
-
24
-
25
-
26
-
27
-
28
-
29
-
30
-
31
-
32
-
33
-
34
-
35
-
36
-
37
-
38
-
39
-
40
-
41
-
42
-
43
-
44
-
45
-
 46
46 -
 47
47 -
 48
48 -
 49
49 -
 50
50 -
 51
51 -
 52
52 -
 53
53 -
 54
54 -
 55
55 -
 56
56 -
 57
57 -
 58
58 -
 59
59 -
 60
60 -
 61
61 -
 62
62 -
 63
63 -
 64
64 -
 65
65 -
 66
66 -
67
-
68
-
69
-
70
-
71
-
72
-
73
-
74
-
75
-
76
-
77
-
78
-
79
-
80
-
81
-
82
-
83
-
84
-
85
-
86
-
87
-
88
-
89
-
90
-
91
-
92
-
93
-
94
-
95
-
96
-
97
-
98
-
99
-
100
-
101
-
102
-
103
-
104
-
105
-
106
-
107
-
108
-
109
-
110
-
111
-
112
-
113
-
114
-
115
-
116
-
117
-
118
-
119
-
120
-
121
-
122
-
123
-
124
-
125
-
126
-
127
-
128
-
129
-
130
-
131
-
132
-
133
-
134
-
135
-
136
-
137
-
138
-
139
-
140
-
141
-
142
-
143
-
144
-
145
-
146
-
147
-
148
-
149
-
150
-
151
-
152
 |
 |

The above charges were partially offset by $14 million of net reversals for changes in estimated reserves from prior
period initiatives.
Restructuring Summary
The restructuring reserve balance as of December 31, 2013 for all programs was $116 million, of which
approximately $108 million is expected to be spent over the next twelve months. In the first quarter 2014, we expect
to incur additional restructuring charges of approximately $0.01 per diluted share for actions and initiatives that have
not yet been finalized. This charge compares to an $8 million net benefit recorded in the first quarter 2013 due to
net reversals from prior periods initiatives exceeding charges incurred in the quarter.
Refer to Note 10 - Restructuring and Asset Impairment Charges in the Consolidated Financial Statements for
additional information regarding our restructuring programs.
Amortization of Intangible Assets
During the year ended December 31, 2013, we recorded $332 million of expense related to the amortization of
intangible assets, which is $4 million higher than the prior year reflecting the increase in acquisitions in 2012.
During the year ended December 31, 2012, we recorded $328 million of expense related to the amortization of
intangible assets, which was $70 million lower than the prior year. 2011 included the $52 million accelerated
amortization of the ACS trade name, which was fully written off in 2011, as a result of the decision to discontinue its
use and transition the services business to the use of the "Xerox" trade name. The impact from the write-off of the
ACS trade name was partially offset by the amortization of intangible assets associated with current and prior-year
acquisitions.
Refer to Note 9 - Goodwill and Intangible assets, Net in the Consolidated Financial Statements for additional
information regarding our intangible assets.
Curtailment Gain
In December 2011, we amended all of our primary non-union U.S. defined benefit pension plans for salaried
employees to fully freeze benefit and service accruals after December 31, 2012. As a result of these plan
amendments, we recognized a pre-tax curtailment gain of $107 million ($66 million after-tax), which represents the
recognition of deferred gains from other prior year amendments (prior service credits) as a result of the
discontinuation (freeze) of any future benefit or service accrual period. The amendments did not materially impact
2012 pension expense.
Refer to Note 15 - Employee Benefit Plans in the Consolidated Financial Statements for additional information
regarding our plan amendments.
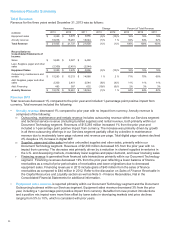
Worldwide Employment
Worldwide employment of 143,100 at December 31, 2013 decreased approximately 4,500 from December 31,
2012, primarily due to restructuring-related actions, normal attrition outpacing hiring and a slower pace of
acquisitions. Worldwide employment was approximately 147,600 and 139,700 at December 2012 and 2011,
respectively.
Other Expenses, Net
Year Ended December 31,
(in millions) 2013 2012 2011
Non-financing interest expense $243 $232 $247
Interest income (11)(13)(21)
(Gains) losses on sales of businesses and assets (64)2(9)
Currency (gains) losses, net (7) 312
Litigation matters (34) (1) 11
Loss on sales of accounts receivables 17 21 20
Loss on early extinguishment of liability ——33
Deferred compensation investment gains (15)(10)—
All other expenses, net 21 27 33
Total Other Expenses, Net $150 $261 $326
39