Xerox 2013 Annual Report Download - page 138
Download and view the complete annual report
Please find page 138 of the 2013 Xerox annual report below. You can navigate through the pages in the report by either clicking on the pages listed below, or by using the keyword search tool below to find specific information within the annual report.-
 1
1 -
2
-
3
-
4
-
5
-
6
-
7
-
8
-
9
-
10
-
11
-
12
-
13
-
14
-
15
-
16
-
17
-
18
-
19
-
20
-
21
-
22
-
23
-
24
-
25
-
26
-
27
-
28
-
29
-
30
-
31
-
32
-
33
-
34
-
35
-
36
-
37
-
38
-
39
-
40
-
41
-
42
-
43
-
44
-
45
-
46
-
47
-
48
-
49
-
50
-
51
-
52
-
53
-
54
-
55
-
56
-
57
-
58
-
59
-
60
-
61
-
62
-
63
-
64
-
65
-
66
-
67
-
68
-
69
-
70
-
71
-
72
-
73
-
74
-
75
-
76
-
77
-
78
-
79
-
80
-
81
-
82
-
83
-
84
-
85
-
86
-
87
-
88
-
89
-
90
-
91
-
92
-
93
-
94
-
95
-
96
-
97
-
98
-
99
-
100
-
101
-
102
-
103
-
104
-
105
-
106
-
107
-
108
-
109
-
110
-
111
-
112
-
113
-
114
-
115
-
116
-
117
-
118
-
119
-
120
-
121
-
122
-
123
-
124
-
125
-
126
-
127
-
 128
128 -
 129
129 -
 130
130 -
 131
131 -
 132
132 -
 133
133 -
 134
134 -
 135
135 -
 136
136 -
 137
137 -
 138
138 -
 139
139 -
 140
140 -
 141
141 -
 142
142 -
 143
143 -
 144
144 -
 145
145 -
 146
146 -
 147
147 -
 148
148 -
149
-
150
-
151
-
152
 |
 |

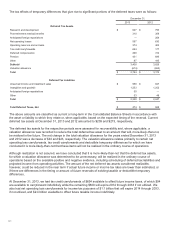
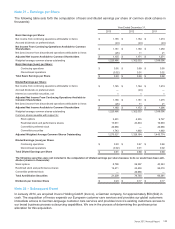
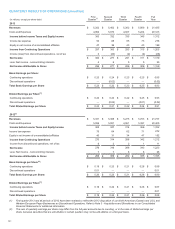
QUARTERLY RESULTS OF OPERATIONS (Unaudited)
(in millions, except per-share data)
First
Quarter(1) Second
Quarter
Third
Quarter
Fourth
Quarter
Full
Year
2013
Revenues $5,202 $5,402 $5,262 $5,569 $21,435
Costs and Expenses 4,902 5,070 4,927 5,224 20,123
Income before Income Taxes and Equity Income 300 332 335 345 1,312
Income tax expense 50 68 85 73 276
Equity in net income of unconsolidated affiliates 47 36 43 43 169
Income from Continuing Operations $297 $300 $293 $315 $1,205
Income (loss) from discontinued operations, net of tax 3 (23) (2) (4) (26)
Net Income $300 $277 $291 $311 $1,179
Less: Net income - noncontrolling interests 4 6 5 520
Net Income Attributable to Xerox $296 $271 $286 $306 $1,159
Basic Earnings per Share:
Continuing operations $ 0.23 $0.24 $0.23 $0.25 $0.95
Discontinued operations — (0.02) — — (0.02)
Total Basic Earnings per Share $0.23 $0.22 $0.23 $0.25 $0.93
Diluted Earnings per Share(2):
Continuing operations $ 0.23 $0.23 $0.22 $0.25 $0.93
Discontinued operations — (0.02) — (0.01)(0.02)
Total Diluted Earnings per Share $0.23 $0.21 $0.22 $0.24 $0.91
2012(1)
Revenues $5,331 $5,368 $5,275 $5,763 $21,737
Costs and Expenses 5,026 5,021 4,961 5,397 20,405
Income before Income Taxes and Equity Income 305 347 314 366 1,332
Income tax expense 75 64 62 71 272
Equity in net income of unconsolidated affiliates 40 31 34 47 152
Income from Continuing Operations 270 314 286 342 1,212
Income from discontinued operations, net of tax 6 2 2 111
Net Income 276 316 288 343 1,223
Less: Net income - noncontrolling interests 7 7 6 828
Net Income Attributable to Xerox $269 $309 $282 $335 $1,195
Basic Earnings per Share(2)::
Continuing operations $ 0.19 $0.23 $0.21 $0.26 $0.89
Discontinued operations 0.01 ———0.01
Total Basic Earnings per Share: $0.20 $0.23 $0.21 $0.26 $0.90
Diluted Earnings per Share(2):
Continuing operations $ 0.19 $0.22 $0.21 $0.26 $0.87
Discontinued operations — — — — 0.01
Total Diluted Earnings per Share $0.19 $0.22 $0.21 $0.26 $0.88
(1) First quarter 2013 and all periods of 2012 have been restated to reflect the 2013 disposition of our North American (Canada and U.S.) and
Western European Paper Businesses as Discontinued Operations. Refer to Note 3 - Acquisitions and Divestitures in our Consolidated
Financial Statements for additional information.
(2) The sum of quarterly earnings per share may differ from the full-year amounts due to rounding, or in the case of diluted earnings per
share, because securities that are anti-dilutive in certain quarters may not be anti-dilutive on a full-year basis.
121