Xerox 2013 Annual Report Download - page 58
Download and view the complete annual report
Please find page 58 of the 2013 Xerox annual report below. You can navigate through the pages in the report by either clicking on the pages listed below, or by using the keyword search tool below to find specific information within the annual report.-
 1
1 -
2
-
3
-
4
-
5
-
6
-
7
-
8
-
9
-
10
-
11
-
12
-
13
-
14
-
15
-
16
-
17
-
18
-
19
-
20
-
21
-
22
-
23
-
24
-
25
-
26
-
27
-
28
-
29
-
30
-
31
-
32
-
33
-
34
-
35
-
36
-
37
-
38
-
39
-
40
-
41
-
42
-
43
-
44
-
45
-
46
-
47
-
 48
48 -
 49
49 -
 50
50 -
 51
51 -
 52
52 -
 53
53 -
 54
54 -
 55
55 -
 56
56 -
 57
57 -
 58
58 -
 59
59 -
 60
60 -
 61
61 -
 62
62 -
 63
63 -
 64
64 -
 65
65 -
 66
66 -
 67
67 -
 68
68 -
69
-
70
-
71
-
72
-
73
-
74
-
75
-
76
-
77
-
78
-
79
-
80
-
81
-
82
-
83
-
84
-
85
-
86
-
87
-
88
-
89
-
90
-
91
-
92
-
93
-
94
-
95
-
96
-
97
-
98
-
99
-
100
-
101
-
102
-
103
-
104
-
105
-
106
-
107
-
108
-
109
-
110
-
111
-
112
-
113
-
114
-
115
-
116
-
117
-
118
-
119
-
120
-
121
-
122
-
123
-
124
-
125
-
126
-
127
-
128
-
129
-
130
-
131
-
132
-
133
-
134
-
135
-
136
-
137
-
138
-
139
-
140
-
141
-
142
-
143
-
144
-
145
-
146
-
147
-
148
-
149
-
150
-
151
-
152
 |
 |

from our foreign subsidiaries, the geographical mix of income and the retroactive tax benefits from the American
Taxpayer Relief Act of 2012 tax law change of approximately $19 million. These benefits were partially offset by the
discrete impact of $12 million for the U.K. corporate income tax rate reduction and the corresponding adjustment to
our U.K. deferred tax assets.
The 2012 effective tax rate was 20.4% or 23.9% on an adjusted basis1. The adjusted tax rate for 2012 was lower
than the U.S. statutory rate primarily due to foreign tax credits resulting from anticipated dividends and other foreign
transactions as well as the geographical mix of profits. In addition, a net tax benefit from adjustments of certain
unrecognized tax positions and deferred tax valuation allowances was offset by a similar impact on deferred tax
assets from the 2012 reduction in the U.K. corporate income tax rate.
The 2011 effective tax rate was 24.6% or 27.5% on an adjusted basis1. The adjusted tax rate for 2011 was lower
than the U.S. statutory rate primarily due to the geographical mix of profits as well as a higher foreign tax credit
benefit as a result of our decision to repatriate current year income from certain non-U.S. subsidiaries.
Xerox operations are widely dispersed. The statutory tax rate in most non U.S. jurisdictions is lower than the
combined U.S. and state tax rate. The amount of income subject to these lower foreign rates relative to the amount
of U.S. income will impact our effective tax rate. However, no one country outside of the U.S. is a significant factor
to our overall effective tax rate. Certain foreign income is subject to U.S. tax net of any available foreign tax credits.
Our full year effective tax rate for 2013 includes a benefit of 11.9-percentage points from these non-U.S. operations.
Refer to Note 16 - Income and Other Taxes, in the Consolidated Financial Statements for additional information
regarding the geographic mix of income before taxes and the related impacts on our effective tax rate.
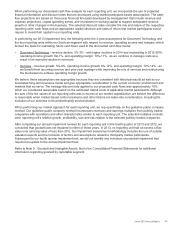
Our effective tax rate is based on nonrecurring events as well as recurring factors, including the taxation of foreign
income. In addition, our effective tax rate will change based on discrete or other nonrecurring events (e.g. audit
settlements, tax law changes, changes in valuation allowances, etc.) that may not be predictable. Excluding the
effects of intangibles amortization and other discrete items, we anticipate that our adjusted effective tax rate will be
approximately 25% to 27% for 2014.
_____________
(1) See the "Non-GAAP Financial Measures" section for an explanation of the adjusted effective tax rate non-GAAP financial measure.
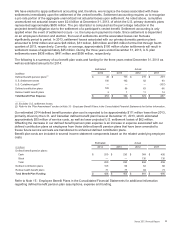
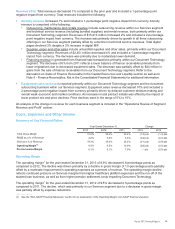
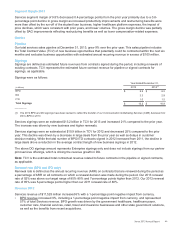
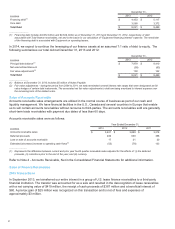
Equity in Net Income of Unconsolidated Affiliates
Year Ended December 31,
(in millions) 2013 2012 2011
Total equity in net income of unconsolidated affiliates $169 $152 $149
Fuji Xerox after-tax restructuring costs 916 19
Equity in net income of unconsolidated affiliates primarily reflects our 25% share of Fuji Xerox.
Refer to Note 8 - Investment in Affiliates, at Equity, in the Consolidated Financial Statements for additional
information regarding our investment in Fuji Xerox.
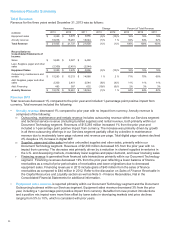
Net Income From Continuing Operations
Net income from continuing operations attributable to Xerox for the year ended December 31, 2013 was $1,185
million, or $0.93 per diluted share. On an adjusted basis1, net income attributable to Xerox was $1,390 million, or
$1.09 per diluted share, and included adjustments for the amortization of intangible assets. The increase in earnings
per diluted share reflects a lower average share count as a result of share repurchases over the last two years.
Net income from continuing operations attributable to Xerox for the year ended December 31, 2012 was $1,184
million, or $0.87 per diluted share. On an adjusted basis1, net income attributable to Xerox was $1,387 million, or
$1.02 per diluted share, and included adjustments for the amortization of intangible assets.
Net income from continuing operations attributable to Xerox for the year ended December 31, 2011 was $1,274
million, or $0.88 per diluted share. On an adjusted basis1, net income attributable to Xerox was $1,542 million, or
$1.06 per diluted share, and included adjustments for the amortization of intangible assets and the loss on early
extinguishment of liability.
_____________
(1) See the "Non-GAAP Financial Measures" section for a reconciliation of reported net income from continuing operations to adjusted net
income.
41