Xerox 2013 Annual Report Download - page 81
Download and view the complete annual report
Please find page 81 of the 2013 Xerox annual report below. You can navigate through the pages in the report by either clicking on the pages listed below, or by using the keyword search tool below to find specific information within the annual report.-
 1
1 -
2
-
3
-
4
-
5
-
6
-
7
-
8
-
9
-
10
-
11
-
12
-
13
-
14
-
15
-
16
-
17
-
18
-
19
-
20
-
21
-
22
-
23
-
24
-
25
-
26
-
27
-
28
-
29
-
30
-
31
-
32
-
33
-
34
-
35
-
36
-
37
-
38
-
39
-
40
-
41
-
42
-
43
-
44
-
45
-
46
-
47
-
48
-
49
-
50
-
51
-
52
-
53
-
54
-
55
-
56
-
57
-
58
-
59
-
60
-
61
-
62
-
63
-
64
-
65
-
66
-
67
-
68
-
69
-
70
-
 71
71 -
 72
72 -
 73
73 -
 74
74 -
 75
75 -
 76
76 -
 77
77 -
 78
78 -
 79
79 -
 80
80 -
 81
81 -
 82
82 -
 83
83 -
 84
84 -
 85
85 -
 86
86 -
 87
87 -
 88
88 -
 89
89 -
 90
90 -
 91
91 -
92
-
93
-
94
-
95
-
96
-
97
-
98
-
99
-
100
-
101
-
102
-
103
-
104
-
105
-
106
-
107
-
108
-
109
-
110
-
111
-
112
-
113
-
114
-
115
-
116
-
117
-
118
-
119
-
120
-
121
-
122
-
123
-
124
-
125
-
126
-
127
-
128
-
129
-
130
-
131
-
132
-
133
-
134
-
135
-
136
-
137
-
138
-
139
-
140
-
141
-
142
-
143
-
144
-
145
-
146
-
147
-
148
-
149
-
150
-
151
-
152
 |
 |

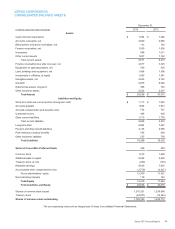
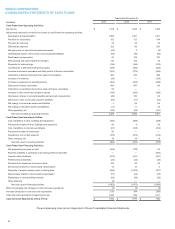
XEROX CORPORATION
CONSOLIDATED BALANCE SHEETS
December 31,
(in millions, except share data in thousands) 2013 2012
Assets
Cash and cash equivalents $ 1,764 $1,246
Accounts receivable, net 2,929 2,866
Billed portion of finance receivables, net 113 152
Finance receivables, net 1,500 1,836
Inventories 998 1,011
Other current assets 1,207 1,162
Total current assets 8,511 8,273
Finance receivables due after one year, net 2,917 3,325
Equipment on operating leases, net 559 535
Land, buildings and equipment, net 1,466 1,556
Investments in affiliates, at equity 1,285 1,381
Intangible assets, net 2,503 2,783
Goodwill 9,205 9,062
Deferred tax assets, long-term 368 763
Other long-term assets 2,222 2,337
Total Assets $29,036 $30,015
Liabilities and Equity
Short-term debt and current portion of long-term debt $ 1,117 $1,042
Accounts payable 1,626 1,913
Accrued compensation and benefits costs 734 741
Unearned income 496 438
Other current liabilities 1,713 1,776
Total current liabilities 5,686 5,910
Long-term debt 6,904 7,447
Pension and other benefit liabilities 2,136 2,958
Post-retirement medical benefits 785 909
Other long-term liabilities 757 778
Total Liabilities 16,268 18,002
Series A Convertible Preferred Stock 349 349
Common stock 1,210 1,239
Additional paid-in capital 5,282 5,622
Treasury stock, at cost (252)(104)
Retained earnings 8,839 7,991
Accumulated other comprehensive loss (2,779)(3,227)
Xerox shareholders’ equity 12,300 11,521
Noncontrolling interests 119 143
Total Equity 12,419 11,664
Total Liabilities and Equity $29,036 $30,015
Shares of common stock issued 1,210,321 1,238,696
Treasury stock (22,001) (14,924)
Shares of common stock outstanding 1,188,320 1,223,772
The accompanying notes are an integral part of these Consolidated Financial Statements.
Xerox 2013 Annual Report 64