Xerox 2010 Annual Report Download - page 93
Download and view the complete annual report
Please find page 93 of the 2010 Xerox annual report below. You can navigate through the pages in the report by either clicking on the pages listed below, or by using the keyword search tool below to find specific information within the annual report.-
 1
1 -
2
-
3
-
4
-
5
-
6
-
7
-
8
-
9
-
10
-
11
-
12
-
13
-
14
-
15
-
16
-
17
-
18
-
19
-
20
-
21
-
22
-
23
-
24
-
25
-
26
-
27
-
28
-
29
-
30
-
31
-
32
-
33
-
34
-
35
-
36
-
37
-
38
-
39
-
40
-
41
-
42
-
43
-
44
-
45
-
46
-
47
-
48
-
49
-
50
-
51
-
52
-
53
-
54
-
55
-
56
-
57
-
58
-
59
-
60
-
61
-
62
-
63
-
64
-
65
-
66
-
67
-
68
-
69
-
70
-
71
-
72
-
73
-
74
-
75
-
76
-
77
-
78
-
79
-
80
-
81
-
82
-
 83
83 -
 84
84 -
 85
85 -
 86
86 -
 87
87 -
 88
88 -
 89
89 -
 90
90 -
 91
91 -
 92
92 -
 93
93 -
 94
94 -
 95
95 -
 96
96 -
 97
97 -
 98
98 -
 99
99 -
 100
100 -
 101
101 -
 102
102 -
 103
103 -
104
-
105
-
106
-
107
-
108
-
109
-
110
-
111
-
112
 |
 |

Notes to the Consolidated
Financial Statements
Dollars in millions, except per-share data and unless otherwise indicated.
91Xerox 2010 Annual Report
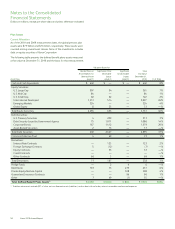
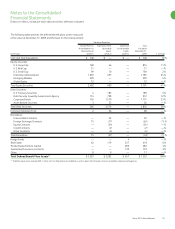
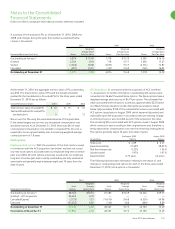
The following table presents the defined benefit plans assets measured
at fair value at December 31, 2009 and the basis for that measurement:
Valuation Based on:
Quoted Prices in Significant Other Significant Total
Active Markets for Observable Unobservable Fair Value
Identical Asset Inputs Inputs December 31,
Asset Class (Level 1) (Level 2) (Level 3) 2009 % of Total
Cash and Cash Equivalents $ 748 $ — $ — $ 748 10%
Equity Securities:
U.S. Large Cap 768 46 — 814 11%
U.S. Mid Cap 31 — — 31 —%
U.S. Small Cap 90 70 — 160 2%
International Developed 1,292 493 — 1,785 24%
Emerging Markets 299 — — 299 4%
Global Equity 12 — — 12 —%
Total Equity Securities 2,492 609 — 3,101 41%
Debt Securities:
U.S. Treasury Securities 4 185 — 189 3%
Debt Security Issued by Government Agency 114 798 — 912 12%
Corporate Bonds 145 1,570 — 1,715 23%
Asset-Backed Securities 3 23 — 26 —%
Total Debt Securities 266 2,576 — 2,842 38%
Common/Collective Trust 2 26 — 28 —%
Derivatives:
Interest Rate Contracts — 52 — 52 —%
Foreign Exchange Contracts 15 (77) — (62) (1)%
Equity Contracts — (24) — (24) —%
Credit Contracts — (2) — (2) —%
Other Contracts — (6) — (6) —%
Total Derivatives 15 (57) — (42) (1)%
Hedge Funds — — 4 4 —%
Real Estate 62 119 237 418 6%
Private Equity/Venture Capital — — 286 286 4%
Guaranteed Insurance Contracts — — 130 130 2%
Other 8 9 — 17 —%
Total Defined Benefit Plans Assets(1) $ 3,593 $ 3,282 $ 657 $ 7,532 100%
(1) Total fair value assets exclude $29 of other net non-financial assets (liabilities) such as due to/from broker, interest receivables and accrued expenses.