Xerox 2010 Annual Report Download - page 30
Download and view the complete annual report
Please find page 30 of the 2010 Xerox annual report below. You can navigate through the pages in the report by either clicking on the pages listed below, or by using the keyword search tool below to find specific information within the annual report.-
 1
1 -
2
-
3
-
4
-
5
-
6
-
7
-
8
-
9
-
10
-
11
-
12
-
13
-
14
-
15
-
16
-
17
-
18
-
19
-
 20
20 -
 21
21 -
 22
22 -
 23
23 -
 24
24 -
 25
25 -
 26
26 -
 27
27 -
 28
28 -
 29
29 -
 30
30 -
 31
31 -
 32
32 -
 33
33 -
 34
34 -
 35
35 -
 36
36 -
 37
37 -
 38
38 -
 39
39 -
 40
40 -
41
-
42
-
43
-
44
-
45
-
46
-
47
-
48
-
49
-
50
-
51
-
52
-
53
-
54
-
55
-
56
-
57
-
58
-
59
-
60
-
61
-
62
-
63
-
64
-
65
-
66
-
67
-
68
-
69
-
70
-
71
-
72
-
73
-
74
-
75
-
76
-
77
-
78
-
79
-
80
-
81
-
82
-
83
-
84
-
85
-
86
-
87
-
88
-
89
-
90
-
91
-
92
-
93
-
94
-
95
-
96
-
97
-
98
-
99
-
100
-
101
-
102
-
103
-
104
-
105
-
106
-
107
-
108
-
109
-
110
-
111
-
112
 |
 |

28
Management’s Discussion
Xerox 2010 Annual Report
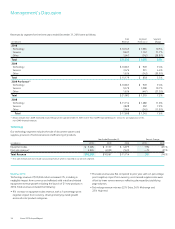
Summary Results
Revenue
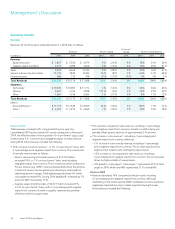
Revenues for the three years ended December 31, 2010 were as follows:
Pro-forma(3)
Revenues Percent Change Change Percent of Total Revenue
(in millions) 2010 2009 2008 2010 2009 2010 2010 2009 2008
Revenue:
Equipment sales $ 3,857 $ 3,550 $ 4,679 9% (24)% 9% 18% 24% 26%
Supplies, paper and other 3,377 3,096 3,646 9% (15)% 4% 15% 20% 21%
Sales 7,234 6,646 8,325 9% (20)% 7% 33% 44% 47%
Service, outsourcing and rentals 13,739 7,820 8,485 76% (8)% 1% 64% 51% 48%
Finance income 660 713 798 (7)% (11)% (7)% 3% 5% 5%
Total Revenues $ 21,633 $ 15,179 $ 17,608 43% (14)% 3% 100% 100% 100%
Segments:
Technology $ 10,349 $ 10,067 $ 11,714 3% (14)% 3% 48% 66% 66%
Services 9,637 3,476 3,828 177% (9)% 3% 44% 23% 22%
Other 1,647 1,636 2,066 1% (21)% 1% 8% 11% 12%
Total Revenues $ 21,633 $ 15,179 $ 17,608 43% (14)% 3% 100% 100% 100%
Memo:
Annuity Revenue (1) $ 17,776 $ 11,629 $ 12,929 53% (10)% 1% 82% 77% 73%
Color (2) $ 6,397 $ 5,972 $ 6,669 7% (10)% 7% 30% 39% 38%
9% increase in equipment sales revenue, including a 1-percentage
•
point negative impact from currency. Growth in install activity was
partially offset by price declines of approximately 5% and mix.
7% increase in color revenue
• (2), including a 1-percentage point
negative impact from currency reflecting:
– 5% increase in color annuity revenue, including a 1-percentage
point negative impact from currency. The increase was driven by
higher printer supplies sales and higher page volumes.
– 12% increase in color equipment sales revenue, including a
2-percentage point negative impact from currency. The increase was
driven by higher installs of new products.
– 9% growth in color pages(4). Color pages(4) represented 23% of total
pages in 2010, while color MIF represented 31% of total MIF.
Revenue2009
Revenue decreased 14% compared to the prior year, including
•
a 3-percentage point negative impact from currency. Although
moderating in the fourth quarter 2009, worldwide economic weakness
negatively impacted our major market segments during the year.
Total revenues included the following:
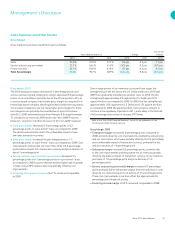
Revenue2010
Total revenues increased 43% compared to the prior year. Our
consolidated 2010 results include ACS results subsequent to February 5,
2010, the effective date of the acquisition. On a pro-forma(3) basis, total
revenue grew 3%. Currency had a negligible impact on total revenues
during 2010. Total revenues included the following:
53% increase in annuity revenue
• (1), or 1% on a pro-forma(3) basis, with
a 1-percentage point negative impact from currency. The components
of annuity revenue were as follows:
– Service, outsourcing and rentals revenue of $13,739 million
increased 76%, or 1% on a pro-forma(3) basis, and included a
negligible impact from currency. The increase was driven by Business
Process Outsourcing (“BPO”) revenue that partially offset the declines
in technical service revenue which were driven by a continued but
stabilizing decline in pages. Total digital pages declined 4%, while
color pages increased 9%. During 2010 digital MIF increased by 1%
and color MIF increased by 15%.
– Supplies, paper and other sales of $3,377 million increased 9%,
or 4% on a pro-forma(3) basis, with a 1-percentage point negative
impact from currency. Growth in supplies revenues was partially
offset by a decline in paper sales.