Xerox 2010 Annual Report Download - page 31
Download and view the complete annual report
Please find page 31 of the 2010 Xerox annual report below. You can navigate through the pages in the report by either clicking on the pages listed below, or by using the keyword search tool below to find specific information within the annual report.-
 1
1 -
2
-
3
-
4
-
5
-
6
-
7
-
8
-
9
-
10
-
11
-
12
-
13
-
14
-
15
-
16
-
17
-
18
-
19
-
20
-
 21
21 -
 22
22 -
 23
23 -
 24
24 -
 25
25 -
 26
26 -
 27
27 -
 28
28 -
 29
29 -
 30
30 -
 31
31 -
 32
32 -
 33
33 -
 34
34 -
 35
35 -
 36
36 -
 37
37 -
 38
38 -
 39
39 -
 40
40 -
 41
41 -
42
-
43
-
44
-
45
-
46
-
47
-
48
-
49
-
50
-
51
-
52
-
53
-
54
-
55
-
56
-
57
-
58
-
59
-
60
-
61
-
62
-
63
-
64
-
65
-
66
-
67
-
68
-
69
-
70
-
71
-
72
-
73
-
74
-
75
-
76
-
77
-
78
-
79
-
80
-
81
-
82
-
83
-
84
-
85
-
86
-
87
-
88
-
89
-
90
-
91
-
92
-
93
-
94
-
95
-
96
-
97
-
98
-
99
-
100
-
101
-
102
-
103
-
104
-
105
-
106
-
107
-
108
-
109
-
110
-
111
-
112
 |
 |

29Xerox 2010 Annual Report
Management’s Discussion
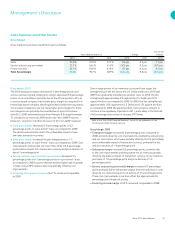
10% decrease in annuity revenue
• (1) including a 3-percentage point
negative impact from currency. The components of the annuity
revenue decreased as follows:
– 8% decrease in service, outsourcing and rentals revenue to
$7,820 million, reflecting a 3-percentage point negative impact
from currency and an overall decline in page volume. Total digital
pages declined 6% despite an increase in color pages of 10%.
Additionally, during 2009 digital MIF increased by 2% and color
MIF increased by 21%.
– Supplies, paper and other sales of $3,096 million decreased 15%
due primarily to currency, which had a 2-percentage point negative
impact, and declines in channel supplies purchases, including lower
purchases within developing markets, and lower paper sales.
24% decrease in equipment sales revenue, including a 1-percentage
•
point negative impact from currency. The overall decline in
install activity was the primary driver, along with price declines of
approximately 5%.
Average shares for the calculation of adjusted EPS for 2010 of 1,378
million include a pro-rata portion of 27 million shares associated with the
Series A convertible preferred stock and therefore the 2010 dividends of
$21 million are excluded. In addition, average shares for the calculation
of adjusted EPS for both 2010 and 2008 include 2 million shares
associated with other convertible securities. We evaluate the dilutive
effect of our convertible securities on an “if-converted” basis. Refer to
Note 20 – Earnings Per Share in the Consolidated Financial Statements
for additional information.
10% decrease in color revenue
• (2) including a 2-percentage point
negative impact from currency reflecting:
– 5% decrease in color annuity revenue including a 3-percentage
point negative impact from currency. The decline was partially driven
by lower channel color printer supplies purchases. Color represented
40% and 37% of annuity revenue in 2009 and 2008, respectively.
– 22% decrease in color equipment sales revenue including a
2-percentage point negative impact from currency and lower installs
driven by the impact of the economic environment. Color sales
represented 53% and 50% of total equipment sales in 2009 and
2008, respectively.
– 10% growth in color pages(4). Color pages(4) represented 21% and
18% of total pages in 2009 and 2008, respectively.
(1) Annuity revenue equals Service, outsourcing and rentals plus Supplies, paper and
other sales plus Finance income.
(2) Color revenues represent a subset of total revenue and exclude the impact of
GIS’s revenues.
(3) Growth on a pro-forma basis reflects the inclusion of ACS’s adjusted results from
February 6 through December 31, 2009. Refer to the “Non-GAAP Financial Measures”
section for an explanation of this non-GAAP financial measure.
(4) Pages include estimates for developing markets, GIS and printers.
(5) Refer to the “Non-GAAP Financial Measures” section for an explanation of this non-
GAAP financial measure.
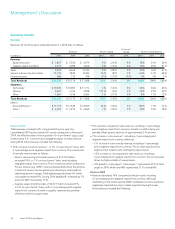
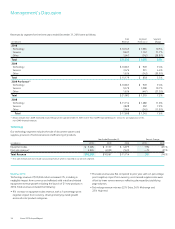
Net Income
Net income and diluted earnings per share, as well as the adjustments to
net income(5) for the three years ended December 31, 2010, were as follows:
2010 2009 2008
(in millions, except per-share amounts) Net Income EPS Net Income EPS Net Income EPS
As Reported $ 606 $ 0.43 $ 485 $ 0.55 $ 230 $ 0.26
Adjustments:
Xerox and Fuji Xerox restructuring charges 355 0.26 41 0.05 308 0.34
Acquisition-related costs 58 0.04 49 0.06 — —
Amortization of intangible assets 194 0.14 38 0.04 35 0.04
ACS shareholders’ litigation settlement 36 0.03 — — — —
Venezuela devaluation costs 21 0.02 — — — —
Medicare subsidy tax law change 16 0.01 — — — —
Provision for litigation matters — — — — 491 0.54
Equipment write-off — — — — 24 0.03
Loss on early extinguishment of debt 10 0.01 — — — —
Settlement of unrecognized tax benefits — — — — (41) (0.05)
As Adjusted(5) $ 1,296 $ 0.94 $ 613 $ 0.70 $ 1,047 $ 1.16
Weighted average shares for reported EPS 1,351 880 895
Weighted average shares for adjusted EPS 1,378 880 897