Xerox 2010 Annual Report Download - page 39
Download and view the complete annual report
Please find page 39 of the 2010 Xerox annual report below. You can navigate through the pages in the report by either clicking on the pages listed below, or by using the keyword search tool below to find specific information within the annual report.-
 1
1 -
2
-
3
-
4
-
5
-
6
-
7
-
8
-
9
-
10
-
11
-
12
-
13
-
14
-
15
-
16
-
17
-
18
-
19
-
20
-
21
-
22
-
23
-
24
-
25
-
26
-
27
-
28
-
 29
29 -
 30
30 -
 31
31 -
 32
32 -
 33
33 -
 34
34 -
 35
35 -
 36
36 -
 37
37 -
 38
38 -
 39
39 -
 40
40 -
 41
41 -
 42
42 -
 43
43 -
 44
44 -
 45
45 -
 46
46 -
 47
47 -
 48
48 -
 49
49 -
50
-
51
-
52
-
53
-
54
-
55
-
56
-
57
-
58
-
59
-
60
-
61
-
62
-
63
-
64
-
65
-
66
-
67
-
68
-
69
-
70
-
71
-
72
-
73
-
74
-
75
-
76
-
77
-
78
-
79
-
80
-
81
-
82
-
83
-
84
-
85
-
86
-
87
-
88
-
89
-
90
-
91
-
92
-
93
-
94
-
95
-
96
-
97
-
98
-
99
-
100
-
101
-
102
-
103
-
104
-
105
-
106
-
107
-
108
-
109
-
110
-
111
-
112
 |
 |

37Xerox 2010 Annual Report
Management’s Discussion
Costs, Expenses and Other Income
Gross Margin
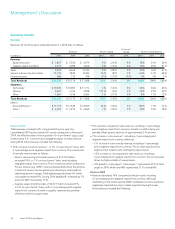
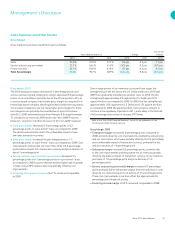
Gross margins by revenue classification were as follows:
Pro-forma(1)
Year Ended December 31, Change Change
2010 2009 2008 2010 2009 2010
Sales 34.5% 33.9% 33.7% 0.6 pts 0.2 pts 1.1 pts
Service, outsourcing and rentals 33.1% 42.6% 41.9% (9.5) pts 0.7 pts (0.7) pts
Finance income 62.7% 62.0% 61.8% 0.7 pts 0.2 pts 0.7 pts
Total Gross Margin 34.4% 39.7% 38.9% (5.3) pts 0.8 pts (0.2) pts
Since a large portion of our inventory is procured from Japan, the
strengthening of the Yen versus the U.S. Dollar and Euro in 2010 and
2009 has significantly impacted our product costs. In 2010, the Yen
strengthened approximately 6% against the U.S. Dollar and 10%
against the Euro as compared to 2009. In 2009, the Yen strengthened
approximately 10% against the U.S. Dollar and 15% against the Euro
as compared to 2008. We expect product costs and gross margins to
continue to be negatively impacted in 2011, particularly in the first half,
if Yen exchange rates remain at January 2011 levels.
(1) Refer to the “Non-GAAP Financial Measures” section for an explanation of the
Pro-forma non-GAAP financial measure.
GrossMargin2009
Totalgrossmargin
• increased 0.8-percentage points compared to
2008, primarily driven by cost improvements, enabled by restructuring
and our cost actions, which were partially offset by the 0.5-percentage
point unfavorable impact of transaction currency, primarily the Yen,
and price declines of 1.0-percentage point.
Salesgrossmargin
• increased 0.2-percentage points, primarily due
to the cost improvements and the positive mix of revenues partially
offset by the adverse impact of transaction currency on our inventory
purchases of 1.0-percentage point and price declines of 1.2-
percentage points.
Service,outsourcingandrentalsmargin
• increased 0.7-percentage
points primarily due to the positive impact from the reduction in costs
driven by our restructuring and cost actions of 1.5-percentage points.
These cost improvements more than offset the approximate 0.9-
percentage point impact of pricing.
Financingincomemargin
• of 62% remained comparable to 2008.
GrossMargin2010
The 2010 total gross margin decreased 5.3-percentage points, and
service, outsourcing and rentals gross margin decreased 9.5-percentage
points, on an actual basis primarily due to the ACS acquisition. ACS, as
a services-based company, had a lower gross margin as compared to a
technology-based company, which typified Xerox before the acquisition.
Since actual comparisons are not meaningful, gross margins for these
two categories are primarily discussed below on a pro-forma basis
with ACS’s 2009 estimated results from February 6 through December
31 included in our historical 2009 results (see “Non-GAAP Financial
Measures” section for a further discussion of this non-GAAP measure).
Totalgrossmargin
• decreased 5.3-percentage points or 0.2-
percentage points on a pro-forma(1) basis, as compared to 2009.
The decline was primarily due to the unfavorable impact of year-
over-year transaction currency.
Salesgrossmargin
• increased 0.6-percentage points or 1.1-
percentage points on a pro-forma(1) basis, as compared to 2009. Cost
improvements and positive mix more than offset a 0.5-percentage
point adverse impact from transaction currency and price declines of
about 1-percentage point.
Service,outsourcingandrentalsgrossmargin
• decreased 9.5-
percentage points or 0.7-percentage points on a pro-forma(1) basis,
as compared to 2009, as price declines and the higher rate of growth
in lower-margin BPO revenue were only partially offset by cost
improvements.
Financingincomegrossmargin
• of 62.7% remained comparable
to 2009.