Xerox 2010 Annual Report Download - page 78
Download and view the complete annual report
Please find page 78 of the 2010 Xerox annual report below. You can navigate through the pages in the report by either clicking on the pages listed below, or by using the keyword search tool below to find specific information within the annual report.-
 1
1 -
2
-
3
-
4
-
5
-
6
-
7
-
8
-
9
-
10
-
11
-
12
-
13
-
14
-
15
-
16
-
17
-
18
-
19
-
20
-
21
-
22
-
23
-
24
-
25
-
26
-
27
-
28
-
29
-
30
-
31
-
32
-
33
-
34
-
35
-
36
-
37
-
38
-
39
-
40
-
41
-
42
-
43
-
44
-
45
-
46
-
47
-
48
-
49
-
50
-
51
-
52
-
53
-
54
-
55
-
56
-
57
-
58
-
59
-
60
-
61
-
62
-
63
-
64
-
65
-
66
-
67
-
 68
68 -
 69
69 -
 70
70 -
 71
71 -
 72
72 -
 73
73 -
 74
74 -
 75
75 -
 76
76 -
 77
77 -
 78
78 -
 79
79 -
 80
80 -
 81
81 -
 82
82 -
 83
83 -
 84
84 -
 85
85 -
 86
86 -
 87
87 -
 88
88 -
89
-
90
-
91
-
92
-
93
-
94
-
95
-
96
-
97
-
98
-
99
-
100
-
101
-
102
-
103
-
104
-
105
-
106
-
107
-
108
-
109
-
110
-
111
-
112
 |
 |
Notes to the Consolidated
Financial Statements
Dollars in millions, except per-share data and unless otherwise indicated.
76 Xerox 2010 Annual Report
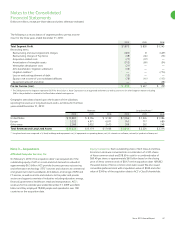
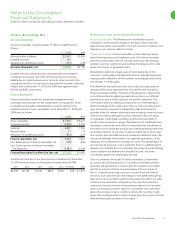
Yen/U.S. Dollar exchange rates used to translate are as follows:
Exchange Basis 2010 2009 2008
Summary of Weighted
Operations Average Rate 87.64 93.51 103.31
Balance Sheet Year-End Rate 81.66 92.46 90.28
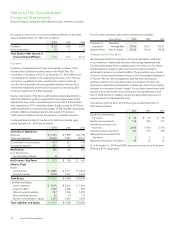
Transactions with Fuji Xerox
We receive dividends from Fuji Xerox, which are reflected as a reduction
in our investment. Additionally, we have a Technology Agreement with
Fuji Xerox whereby we receive royalty payments for their use of our Xerox
brand trademark, as well as rights to access their patent portfolio in
exchange for access to our patent portfolio. These payments are included
in Service, outsourcing and rental revenues in the Consolidated Statements
of Income. We also have arrangements with Fuji Xerox whereby we
purchase inventory from and sell inventory to Fuji Xerox. Pricing of the
transactions under these arrangements is based upon terms the Company
believes to be conducted at arm’s length. Our purchase commitments with
Fuji Xerox are in the normal course of business and typically have a lead
time of three months. In addition, we pay Fuji Xerox and they pay us for
unique research and development costs.
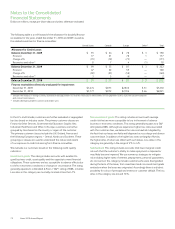
Transactions with Fuji Xerox for the three years ended December 31,
2010 were as follows:
2010 2009 2008
Dividends received from
Fuji Xerox $ 36 $ 10 $ 56
Royalty revenue earned 116 106 112
Inventory purchases from
Fuji Xerox 2,098 1,590 2,150
Inventory sales to Fuji Xerox 147 133 162
R&D payments received from
Fuji Xerox 1 3 5
R&D payments paid to Fuji Xerox 30 33 34
As of December 31, 2010 and 2009, net amounts due to Fuji Xerox were
$109 and $114, respectively.
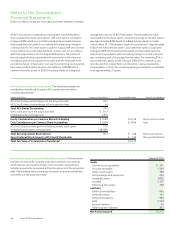
Our equity in net income of our unconsolidated affiliates for the three
years ended December 31, 2010 was as follows:
2010 2009 2008
Fuji Xerox $ 63 $ 30 $ 101
Other investments 15 11 12
Total Equity in Net Income of
Unconsolidated Affiliates $ 78 $ 41 $ 113
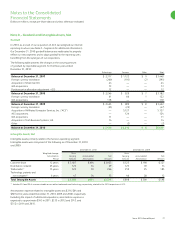
Fuji Xerox
Fuji Xerox is headquartered in Tokyo and operates in Japan, China,
Australia, New Zealand and other areas of the Pacific Rim. Our
investment in Fuji Xerox of $1,217 at December 31, 2010 differs from
our implied 25% interest in the underlying net assets, or $1,335, due
primarily to our deferral of gains resulting from sales of assets by
us to Fuji Xerox, partially offset by goodwill related to the Fuji Xerox
investment established at the time we acquired our remaining 20%
of Xerox Limited from The Rank Group plc.
Equity in net income of Fuji Xerox is affected by certain adjustments to
reflect the deferral of profit associated with intercompany sales. These
adjustments may result in recorded equity income that is different than
that implied by our 25% ownership interest. Equity income for 2010 and
2009 includes after-tax restructuring charges of $38 and $46, respectively,
primarily reflecting employee-related costs as part of Fuji Xerox’s
continued cost-reduction actions to improve its competitive position.
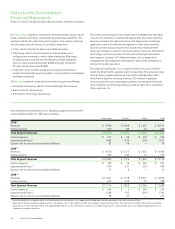
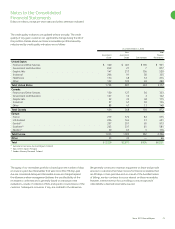
Condensed financial data of Fuji Xerox for the three calendar years
ended December 31, 2010 was as follows:
2010 2009 2008
Summary of Operations
Revenues $ 11,276 $ 9,998 $ 11,190
Costs and expenses 10,659 9,781 10,451
Income before income taxes 617 217 739
Income tax expense 291 67 287
Net Income 326 150 452
Less: Net income –
noncontrolling interests 5 1 7
Net Income – Fuji Xerox $ 321 $ 149 $ 445
Balance Sheet
Assets:
Current assets $ 4,884 $ 4,111 $ 4,734
Long-term assets 5,978 5,457 5,470
Total Assets $ 10,862 $ 9,568 $ 10,204
Liabilities and Equity:
Current liabilities $ 3,534 $ 2,643 $ 3,534
Long-term debt 1,260 1,368 996
Other long-term liabilities 707 1,104 1,095
Noncontrolling interests 22 19 23
Fuji Xerox shareholders’ equity 5,339 4,434 4,556
Total Liabilities and Equity $ 10,862 $ 9,568 $ 10,204