Xerox 2010 Annual Report Download - page 48
Download and view the complete annual report
Please find page 48 of the 2010 Xerox annual report below. You can navigate through the pages in the report by either clicking on the pages listed below, or by using the keyword search tool below to find specific information within the annual report.-
 1
1 -
2
-
3
-
4
-
5
-
6
-
7
-
8
-
9
-
10
-
11
-
12
-
13
-
14
-
15
-
16
-
17
-
18
-
19
-
20
-
21
-
22
-
23
-
24
-
25
-
26
-
27
-
28
-
29
-
30
-
31
-
32
-
33
-
34
-
35
-
36
-
37
-
 38
38 -
 39
39 -
 40
40 -
 41
41 -
 42
42 -
 43
43 -
 44
44 -
 45
45 -
 46
46 -
 47
47 -
 48
48 -
 49
49 -
 50
50 -
 51
51 -
 52
52 -
 53
53 -
 54
54 -
 55
55 -
 56
56 -
 57
57 -
 58
58 -
59
-
60
-
61
-
62
-
63
-
64
-
65
-
66
-
67
-
68
-
69
-
70
-
71
-
72
-
73
-
74
-
75
-
76
-
77
-
78
-
79
-
80
-
81
-
82
-
83
-
84
-
85
-
86
-
87
-
88
-
89
-
90
-
91
-
92
-
93
-
94
-
95
-
96
-
97
-
98
-
99
-
100
-
101
-
102
-
103
-
104
-
105
-
106
-
107
-
108
-
109
-
110
-
111
-
112
 |
 |

46
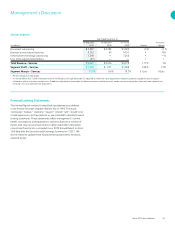
Management’s Discussion
Xerox 2010 Annual Report
In October 2010, Xerox’s Board of Directors authorized the company
•
to issue Commercial Paper, a liquidity vehicle that the Company has
not used for several years. Aggregate CP and Credit Facility borrowings
may not exceed $2 billion outstanding at any time. Under the
company’s private placement CP program as of December 31, 2010,
we could issue CP up to a maximum amount of $1 billion. In February
2011 this amount was increased to $2 billion to be consistent with the
Board authorization.
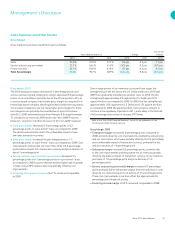
Over the past three years we have consistently delivered strong cash
•
flow from operations, driven by the strength of our annuity-based
revenue model. Cash flows from operations were $2,726 million,
$2,208 million and $939 million for the years ended December 31,
2010, 2009 and 2008, respectively. Cash flows from operations in
2008 included $615 million in net payments for securities litigation.
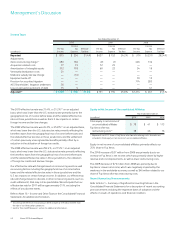
Our principal debt maturities are in line with historical and projected
•
cash flows and are spread over the next 10 years as follows and
includes $300 million of Commercial Paper in 2011 (in millions):
Year Amount
2011 $ 1,370
2012 1,126
2013 412
2014 771
2015 1,251
2016 950
2017 501
2018 1,001
2019 650
2020 and thereafter 348
Total Debt $ 8,380
LoanCovenantsandCompliance
At December 31, 2010, we were in full compliance with the covenants
and other provisions of our Credit Facility and Senior Notes. We have
the right to prepay outstanding loans or to terminate the Credit Facility
without penalty. Failure to comply with material provisions or covenants
of the Credit Facility and Senior Notes could have a material adverse
effect on our liquidity and operations and our ability to continue to fund
our customers’ purchase of Xerox equipment.
Refer to Note 11 – Debt in the Consolidated Financial Statements for
additional information regarding debt arrangements.
Dividends
The Board of Directors declared aggregate dividends of $243 million
and $152 million on common stock in 2010 and 2009, respectively.
The increase in 2010 is primarily due to the common stock issued in
connection with the ACS acquisition.
The Board of Directors declared aggregate dividends of $21 million on
the Series A Convertible Preferred Stock in 2010. The preferred shares
were issued in connection with the acquisition of ACS.
Refer to Note 3 – Acquisitions in the Consolidated Financial Statements
for additional information regarding the ACS acquisition.
CapitalMarketActivity
In 2010, we redeemed our $550 million 7.625% Senior Notes due in
2013. We incurred a loss on extinguishment of approximately $15
million, representing the call premium of approximately $7 million, as
well as the write-off of unamortized debt costs of $8 million.
Refer to Note 11 – Debt in the Consolidated Financial Statements for
additional information regarding 2010 Debt activity.
Liquidity and Financial Flexibility
We manage our worldwide liquidity using internal cash management
practices, which are subject to (1) the statutes, regulations and
practices of each of the local jurisdictions in which we operate, (2) the
legal requirements of the agreements to which we are a party and (3)
the policies and cooperation of the financial institutions we utilize to
maintain and provide cash management services.
Our liquidity is a function of our ability to successfully generate cash
flows from a combination of efficient operations and access to capital
markets. Our ability to maintain positive liquidity going forward depends
on our ability to continue to generate cash from operations and access
to financial markets, both of which are subject to general economic,
financial, competitive, legislative, regulatory and other market factors
that are beyond our control.
The following is a discussion of our liquidity position as of
December 31, 2010:
Total cash and cash equivalents was $1.2 billion and there were
•
no outstanding borrowings or letters of credit under our $2 billion
Credit Facility. The Credit Facility provides backup for our Commercial
Paper (“CP”) borrowings which amounted to $300 million at
December 31, 2010.