Xerox 2010 Annual Report Download - page 65
Download and view the complete annual report
Please find page 65 of the 2010 Xerox annual report below. You can navigate through the pages in the report by either clicking on the pages listed below, or by using the keyword search tool below to find specific information within the annual report.-
 1
1 -
2
-
3
-
4
-
5
-
6
-
7
-
8
-
9
-
10
-
11
-
12
-
13
-
14
-
15
-
16
-
17
-
18
-
19
-
20
-
21
-
22
-
23
-
24
-
25
-
26
-
27
-
28
-
29
-
30
-
31
-
32
-
33
-
34
-
35
-
36
-
37
-
38
-
39
-
40
-
41
-
42
-
43
-
44
-
45
-
46
-
47
-
48
-
49
-
50
-
51
-
52
-
53
-
54
-
 55
55 -
 56
56 -
 57
57 -
 58
58 -
 59
59 -
 60
60 -
 61
61 -
 62
62 -
 63
63 -
 64
64 -
 65
65 -
 66
66 -
 67
67 -
 68
68 -
 69
69 -
 70
70 -
 71
71 -
 72
72 -
 73
73 -
 74
74 -
 75
75 -
76
-
77
-
78
-
79
-
80
-
81
-
82
-
83
-
84
-
85
-
86
-
87
-
88
-
89
-
90
-
91
-
92
-
93
-
94
-
95
-
96
-
97
-
98
-
99
-
100
-
101
-
102
-
103
-
104
-
105
-
106
-
107
-
108
-
109
-
110
-
111
-
112
 |
 |

Notes to the Consolidated
Financial Statements
Dollars in millions, except per-share data and unless otherwise indicated.
63Xerox 2010 Annual Report
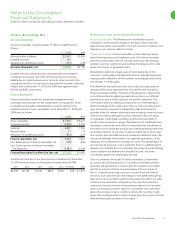
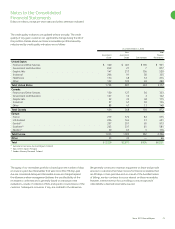
Restricted cash amounts at December 31, 2010 and 2009 were
as follows:
2010 2009
Tax and labor litigation deposits in Brazil $ 276 $ 240
Escrow and cash collections related
to receivable sales 88 29
Other restricted cash 7 20
Total Restricted Cash and Investments $ 371 $ 289
Inventories
Inventories are carried at the lower of average cost or market.
Inventories also include equipment that is returned at the end of the
lease term. Returned equipment is recorded at the lower of remaining
net book value or salvage value. Salvage value consists of the estimated
market value (generally determined based on replacement cost) of
the salvageable component parts, which are expected to be used in
the remanufacturing process. We regularly review inventory quantities
and record a provision for excess and/or obsolete inventory based
primarily on our estimated forecast of product demand, production
requirements and servicing commitments. Several factors may influence
the realizability of our inventories, including our decision to exit a
product line, technological changes and new product development.
The provision for excess and/or obsolete raw materials and equipment
inventories is based primarily on near-term forecasts of product demand
and include consideration of new product introductions, as well as
changes in remanufacturing strategies. The provision for excess and/or
obsolete service parts inventory is based primarily on projected servicing
requirements over the life of the related equipment populations.
Land, Buildings and Equipment and Equipment on Operating Leases
Land, buildings and equipment are recorded at cost. Buildings and
equipment are depreciated over their estimated useful lives. Leasehold
improvements are depreciated over the shorter of the lease term or
the estimated useful life. Equipment on operating leases is depreciated
to estimated salvage value over the lease term. Depreciation is
computed using the straight-line method. Significant improvements
are capitalized and maintenance and repairs are expensed. Refer to
Note 5 – Inventories and Equipment on Operating Leases, Net and
Note 6 – Land, Buildings and Equipment, Net for further discussion.
Software – Internal Use and Product
We capitalize direct costs associated with developing, purchasing or
otherwise acquiring software for internal use and amortize these costs
on a straight-line basis over the expected useful life of the software,
beginning when the software is implemented (“Internal Use Software”).
Costs incurred for upgrades and enhancements that will not result in
additional functionality are expensed as incurred. Useful lives of Internal
Use Software generally vary from three to 10 years.
Consideration in a multiple-element arrangement is allocated at the
inception of the arrangement to all deliverables on the basis of the
relative selling price. When applying the relative selling price method, the
selling price for each deliverable is determined using VSOE of the selling
price, or TPE of the selling price. If neither VSOE nor TPE of the selling
price exists for a deliverable, we will use our best estimate of the selling
price for that deliverable.
The new guidance with respect to multiple-element arrangements did
not change the allocation of arrangement consideration to the units of
accounting or the pattern and timing of revenue recognition for those
units. Normally our equipment and services will qualify as separate
units of accounting, which are the majority of our multiple-element
arrangements. In addition, under previous guidance, consideration for
multiple-element arrangements was allocated based on VSOE or TPE,
since products and services are generally sold separately or the selling
price is determinable based on competitor prices for similar deliverables.
As a result, for substantially all of our multiple-element arrangements,
we will continue using VSOE or TPE to allocate the arrangement
consideration to each respective deliverable.
Although infrequent, under previous guidance with respect to multiple-
element arrangements, if we were unable to establish the selling
price using VSOE or TPE, arrangement consideration was allocated
using the residual method or recognized ratably over the contractual
service period. However, since the new guidance allows for the use of
our best estimate of the selling price in our allocation of arrangement
consideration if VSOE or TPE is not determinable, we now use our best
estimate of selling price in those infrequent situations. The objective of
using estimated selling price-based methodology is to determine the
price at which we would transact a sale if the product or service were
sold on a stand-alone basis. Accordingly, we determine our best estimate
of selling price considering multiple factors including, but not limited to,
geographies, market conditions, competitive landscape, internal costs,
gross margin objectives and pricing practices. Estimated selling price
based methodology generally will apply to an insignificant proportion
of our arrangements with multiple deliverables.
Cash and Cash Equivalents
Cash and cash equivalents consist of cash on hand, including
money-market funds, and investments with original maturities of
three months or less.
Restricted Cash and Investments
As more fully discussed in Note 17 – Contingencies, various litigation
matters in Brazil require us to make cash deposits as a condition of
continuing the litigation. In addition, several of our secured financing
arrangements and other contracts require us to post cash collateral
or maintain minimum cash balances in escrow. These cash amounts
are classified in our Consolidated Balance Sheets based on when the
cash will be contractually or judicially released (refer to Note 10 –
Supplementary Financial Information for classification of amounts).