Xerox 2010 Annual Report Download - page 73
Download and view the complete annual report
Please find page 73 of the 2010 Xerox annual report below. You can navigate through the pages in the report by either clicking on the pages listed below, or by using the keyword search tool below to find specific information within the annual report.-
 1
1 -
2
-
3
-
4
-
5
-
6
-
7
-
8
-
9
-
10
-
11
-
12
-
13
-
14
-
15
-
16
-
17
-
18
-
19
-
20
-
21
-
22
-
23
-
24
-
25
-
26
-
27
-
28
-
29
-
30
-
31
-
32
-
33
-
34
-
35
-
36
-
37
-
38
-
39
-
40
-
41
-
42
-
43
-
44
-
45
-
46
-
47
-
48
-
49
-
50
-
51
-
52
-
53
-
54
-
55
-
56
-
57
-
58
-
59
-
60
-
61
-
62
-
 63
63 -
 64
64 -
 65
65 -
 66
66 -
 67
67 -
 68
68 -
 69
69 -
 70
70 -
 71
71 -
 72
72 -
 73
73 -
 74
74 -
 75
75 -
 76
76 -
 77
77 -
 78
78 -
 79
79 -
 80
80 -
 81
81 -
 82
82 -
 83
83 -
84
-
85
-
86
-
87
-
88
-
89
-
90
-
91
-
92
-
93
-
94
-
95
-
96
-
97
-
98
-
99
-
100
-
101
-
102
-
103
-
104
-
105
-
106
-
107
-
108
-
109
-
110
-
111
-
112
 |
 |

Notes to the Consolidated
Financial Statements
Dollars in millions, except per-share data and unless otherwise indicated.
71Xerox 2010 Annual Report
Provisions for Losses on Uncollectible Receivables
Accounts Receivable: The allowance for uncollectible accounts
receivables is determined principally on the basis of past collection
experience as well as consideration of current economic conditions and
changes in our customer collection trends.
Finance Receivables: Finance receivables include sales-type leases,
direct financing leases and installment loans. Our finance receivable
portfolios are primarily in the US, Canada and Europe. We generally
establish customer credit limits and estimate the allowance for credit
losses on a country or geographic basis.
We establish credit limits based upon an initial evaluation of the
customer’s credit quality and adjust that limit accordingly based upon
ongoing credit evaluations of the customer including payment history
and changes in credit quality.
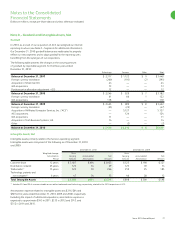
The allowance for doubtful accounts and credit losses represents an
estimate of the losses expected to be incurred from the Company’s
finance receivable portfolio. The level of the allowance is determined
on a collective basis by applying projected loss rates to our different
portfolios by country, which represent our portfolio segments. This
is the level at which we develop and document our methodology to
determine allowance for credit losses. This loss rate is primarily based
upon historical loss experience adjusted for judgments about the
probable effects of relevant observable data including current economic
conditions as well as delinquency trends, resolution rates, the aging
of receivables, credit quality indicators and the financial health of
specific customer classes or groups. The allowance for doubtful finance
receivables is inherently more difficult to estimate than the allowance
for trade accounts receivable because the underlying lease portfolio has
an average maturity, at any time, of approximately two to three years
and contains past due billed amounts, as well as unbilled amounts. We
consider all available information in our quarterly assessments of the
adequacy of the allowance for doubtful accounts. The identification of
account-specific exposure is not a significant factor in establishing the
allowance for doubtful finance receivables. Our policy and methodology
used to establish our allowance for doubtful accounts has been
consistently applied over all periods presented.
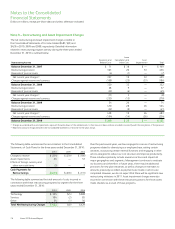
Since our allowance for doubtful Finance receivables is determined
by country, the risk characteristics in our finance receivable portfolio
segments will generally be consistent with the risk factors associated
with the economies of those countries/regions. The economies of
the U.S., Canada and Europe continue to recover from the financial
economic crises and recession which began in late 2008. Although loss
rates across all our portfolio segments have declined in 2010, loss rates
continue to be elevated as compared to prior years. Since Europe is
composed of varied countries and regional economies, the risk profile
within our European portfolio segment is somewhat more diversified
due to the varying economic conditions among the countries. Credit
losses have increased within southern Europe given the current economic
difficulties facing the countries in this region.
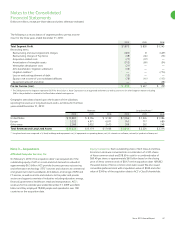
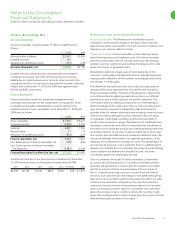
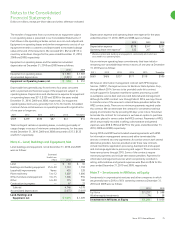
Note 4 – Receivables, Net
Accounts Receivable
Accounts receivable, net at December 31, 2010 and 2009 were as
follows:
2010 2009
Amounts billed or billable $ 2,491 $ 1,850
Unbilled amounts 447 —
Allowance for doubtful accounts (112) (148)
Accounts Receivable, net $ 2,826 $ 1,702
Unbilled amounts include amounts associated with percentage-of-
completion accounting, and other earned revenues not currently
billable due to contractual provisions. Amounts to be invoiced in the
subsequent month for current services provided are included in amounts
billable, and at December 31, 2010 and 2009 were approximately
$1,066 and $603, respectively.
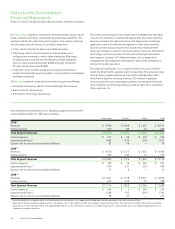
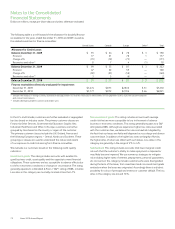
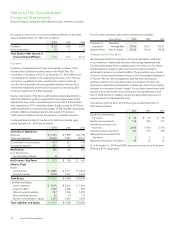
Finance Receivables
Finance receivables result from installment arrangements and
sales-type leases arising from the marketing of our equipment. These
receivables are typically collateralized by a security interest in the
underlying assets. Finance receivables, net at December 31, 2010 and
2009 were as follows:
2010 2009
Gross receivables $ 7,914 $ 8,427
Unearned income (1,093) (1,197)
Subtotal 6,821 7,230
Residual values 11 19
Allowance for doubtful accounts (212) (222)
Finance receivables, net 6,620 7,027
Less: Billed portion of finance receivables, net (198) (226)
Less: Current portion of finance receivables
not billed, net (2,287) (2,396)
Finance Receivables Due After One Year, net $ 4,135 $ 4,405
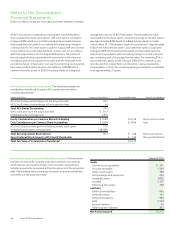
Contractual maturities of our gross finance receivables as of December
31, 2010 were as follows (including those already billed of $198):
2011 2012 2013 2014 2015 Thereafter Total
$2,978 $2,178 $1,527 $862 $330 $39 $ 7,914