Xerox 2010 Annual Report Download - page 82
Download and view the complete annual report
Please find page 82 of the 2010 Xerox annual report below. You can navigate through the pages in the report by either clicking on the pages listed below, or by using the keyword search tool below to find specific information within the annual report.-
 1
1 -
2
-
3
-
4
-
5
-
6
-
7
-
8
-
9
-
10
-
11
-
12
-
13
-
14
-
15
-
16
-
17
-
18
-
19
-
20
-
21
-
22
-
23
-
24
-
25
-
26
-
27
-
28
-
29
-
30
-
31
-
32
-
33
-
34
-
35
-
36
-
37
-
38
-
39
-
40
-
41
-
42
-
43
-
44
-
45
-
46
-
47
-
48
-
49
-
50
-
51
-
52
-
53
-
54
-
55
-
56
-
57
-
58
-
59
-
60
-
61
-
62
-
63
-
64
-
65
-
66
-
67
-
68
-
69
-
70
-
71
-
 72
72 -
 73
73 -
 74
74 -
 75
75 -
 76
76 -
 77
77 -
 78
78 -
 79
79 -
 80
80 -
 81
81 -
 82
82 -
 83
83 -
 84
84 -
 85
85 -
 86
86 -
 87
87 -
 88
88 -
 89
89 -
 90
90 -
 91
91 -
 92
92 -
93
-
94
-
95
-
96
-
97
-
98
-
99
-
100
-
101
-
102
-
103
-
104
-
105
-
106
-
107
-
108
-
109
-
110
-
111
-
112
 |
 |

Notes to the Consolidated
Financial Statements
Dollars in millions, except per-share data and unless otherwise indicated.
80 Xerox 2010 Annual Report
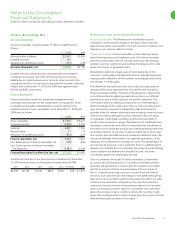
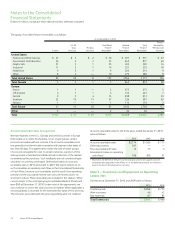
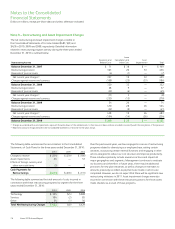
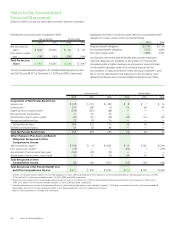
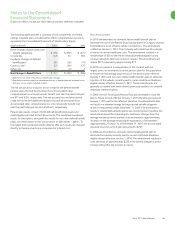
Long-term debt at December 31, 2010 and 2009 was as follows:
Weighted Average
Interest Rates at
December 31, 2010(2) 2010 2009
Xerox Corporation
Senior Notes due 2010 —% $ — $ 700
Notes due 2011 0.09% 1 1
Notes due 2011 —% — 50
Senior Notes due 2011 6.59% 750 750
Senior Notes due 2012 5.59% 1,100 1,100
Senior Notes due 2013 5.65% 400 400
Senior Notes due 2013 —% — 550
Convertible Notes due 2014 9.00% 19 19
Senior Notes due 2014 8.25% 750 750
Senior Notes due 2015 4.29% 1,000 1,000
Notes due 2016 7.20% 250 250
Senior Notes due 2016 6.48% 700 700
Senior Notes due 2017 6.83% 500 500
Senior Notes due 2018 6.37% 1,000 1,000
Senior Notes due 2019 5.66% 650 650
Zero Coupon Notes due 2023 5.41% 283 267
Senior Notes due 2039 6.78% 350 350
Subtotal $ 7,753 $ 9,037
Xerox Credit Corporation
Notes due 2013 —% — 10
Notes due 2014 —% — 50
Subtotal — 60
ACS
Notes due 2015 4.25% 250 —
Borrowings secured by other assets 6.62% 71 —
Subtotal 321 —
Other U.S. Operations
Borrowings secured by
finance receivables —% — 2
Borrowings secured by
other assets 12.39% 4 5
Subtotal 4 7
Total U.S. Operations 8,078 9,104
International Operations
Other debt due 2011–2013 0.86% 2 18
Total International Operations 2 18
Principal Debt Balance 8,080 9,122
Unamortized discount (1) (11)
Fair value adjustments(1) 228 153
Less: current maturities (1,070) (988)
Total Long-term Debt $ 7,237 $ 8,276
(1) Fair value adjustments represent changes in the fair value of hedged debt
obligations attributable to movements in benchmark interest rates. Hedge accounting
requires hedged debt instruments to be reported at an amount equal to the sum of
their carrying value (principal value plus/minus premiums/discounts) and any fair
value adjustment.
(2) Represents weighted average effective interest rate which includes the effect of
discounts and premiums on issued debt.
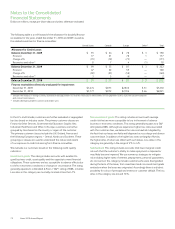
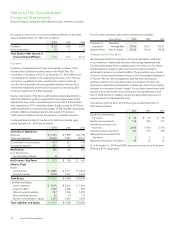
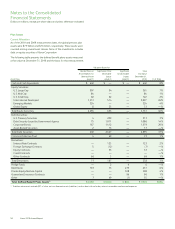
The components of other long-term assets and other long-term liabilities
at December 31, 2010 and 2009 were as follows:
2010 2009
Other Long-term Assets
Prepaid pension costs $ 92 $ 155
Net investment in discontinued operations(1) 224 240
Internal use software, net 468 354
Product software, net 145 10
Restricted cash 280 258
Debt issuance costs, net 42 62
Customer contract costs, net 134 —
Derivative instruments 11 10
Other 378 231
Total Other Long-term Assets $ 1,774 $ 1,320
Other Long-term Liabilities
Deferred and other tax liabilities $ 200 $ 167
Derivative instruments — 9
Environmental reserves 20 23
Unearned income 36 —
Restructuring reserves 14 10
Other 527 363
Total Other Long-term Liabilities $ 797 $ 572
(1) At December 31, 2010, our net investment in discontinued operations primarily
consists of a $245 performance-based instrument relating to the 1997 sale of
The Resolution Group (“TRG”) net of remaining net liabilities associated with our
discontinued operations of $21. The recovery of the performance-based instrument is
dependent on the sufficiency of TRG’s available cash flows, as guaranteed by TRG’s
ultimate parent, which are expected to be recovered in annual cash distributions
through 2017.
Note 11 – Debt
Short-term borrowings at December 31, 2010 and 2009 were as follows:
2010 2009
Commercial paper $ 300 $ —
Current maturities of long-term debt 1,070 988
Total Short-term Debt $ 1,370 $ 988
The weighted-average interest rate for commercial paper at December
31, 2010, including issuance costs, was 1.02% and had maturities
ranging from 18 to 32 days.
We classify our debt based on the contractual maturity dates of the
underlying debt instruments or as of the earliest put date available to
the debt holders. We defer costs associated with debt issuance over the
applicable term, or to the first put date in the case of convertible debt or
debt with a put feature. These costs are amortized as interest expense in
our Consolidated Statements of Income.