Xerox 2010 Annual Report Download - page 40
Download and view the complete annual report
Please find page 40 of the 2010 Xerox annual report below. You can navigate through the pages in the report by either clicking on the pages listed below, or by using the keyword search tool below to find specific information within the annual report.-
 1
1 -
2
-
3
-
4
-
5
-
6
-
7
-
8
-
9
-
10
-
11
-
12
-
13
-
14
-
15
-
16
-
17
-
18
-
19
-
20
-
21
-
22
-
23
-
24
-
25
-
26
-
27
-
28
-
29
-
 30
30 -
 31
31 -
 32
32 -
 33
33 -
 34
34 -
 35
35 -
 36
36 -
 37
37 -
 38
38 -
 39
39 -
 40
40 -
 41
41 -
 42
42 -
 43
43 -
 44
44 -
 45
45 -
 46
46 -
 47
47 -
 48
48 -
 49
49 -
 50
50 -
51
-
52
-
53
-
54
-
55
-
56
-
57
-
58
-
59
-
60
-
61
-
62
-
63
-
64
-
65
-
66
-
67
-
68
-
69
-
70
-
71
-
72
-
73
-
74
-
75
-
76
-
77
-
78
-
79
-
80
-
81
-
82
-
83
-
84
-
85
-
86
-
87
-
88
-
89
-
90
-
91
-
92
-
93
-
94
-
95
-
96
-
97
-
98
-
99
-
100
-
101
-
102
-
103
-
104
-
105
-
106
-
107
-
108
-
109
-
110
-
111
-
112
 |
 |

38
Management’s Discussion
Xerox 2010 Annual Report
RD&E2010
The decrease in RD&E spending for 2010 primarily reflects the savings
from restructuring and productivity improvements.
SAG2010
SAG as a percent of revenue decreased 6.1-percentage points on an
actual basis, primarily due to the ACS acquisition. ACS, as a typical
services-based company, had lower SAG as a percent of revenue as
compared to a technology-based company, which typified Xerox before
the acquisition. Since actual comparisons are not meaningful, SAG is
primarily discussed on a pro-forma basis, with ACS’s 2009 estimated
results from February 6 through December 31 included in our historical
2009 results (see “Non-GAAP Financial Measures” section for additional
discussion of this non-GAAP measure).
RD&E2009
The decrease in RD&E spending for 2009 reflects our restructuring and
cost actions which consolidated the development and engineering
infrastructures within our Technology segment.
SAG of $4,594 million was $445 million higher than 2009, or $57
million lower on a pro-forma(1) basis, including a negligible impact from
currency. The pro-forma(1) SAG decrease reflects the following:
$137 million increase in selling expenses, reflecting increased demand
•
generation and brand advertising and higher commissions, partially
offset by restructuring savings and productivity improvements
$86 million decrease in general and administrative expenses, reflecting
•
benefits from restructuring and operational improvements
$108 million decrease in bad debt expense, reflecting an improving
•
write-off trend
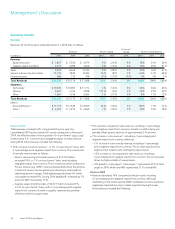
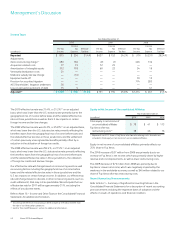
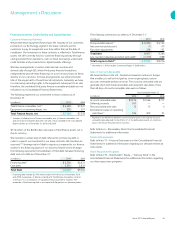
Research, Development and Engineering Expenses (“RD&E”)
We invest in technological research and development, particularly in
color, software and services. We believe our R&D spending is sufficient to
remain technologically competitive. Our R&D is strategically coordinated
with that of Fuji Xerox.
Pro-forma(1)
Year Ended December 31, Change Change
(in millions) 2010 2009 2008 2010 2009 2010
R&D $ 653 $ 713 $ 750 $ (60) $ (37) $ (60)
Sustaining Engineering 128 127 134 1 (7) 1
Total RD&E Expenses $ 781 $ 840 $ 884 $ (59) $ (44) $ (59)
RD&E % Revenue 3.6% 5.5% 5.0% (1.9) pts 0.5 pts (0.4) pts
R&D Investment by Fuji Xerox(2) $ 821 $ 796 $ 788 $ 25 $ 8 n/a
(1) Refer to the “Non-GAAP Financial Measures” section for an explanation of the Pro-forma non-GAAP financial measure.
(2) Increase in Fuji Xerox R&D was primarily due to changes in foreign exchange rates.
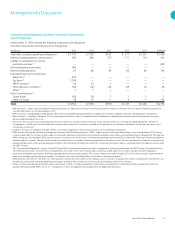
Selling, Administrative and General Expenses (“SAG”)
Pro-forma(1)
Year Ended December 31, Change Change
(in millions) 2010 2009 2008 2010 2009 2010
Total SAG $ 4,594 $ 4,149 $ 4,534 $ 445 $ (385) $ (57)
SAG as a % of revenue 21.2% 27.3% 25.7% (6.1) pts 1.6 pts (0.9) pts
Bad Debt Expense $ 188 $ 291 $ 188 $ (103) $ 103 $ (108)
Bad Debt as a % of revenue 0.9% 1.9% 1.1% (1.0) pts 0.8 pts (0.5) pts
(1) Refer to the “Non-GAAP Financial Measures” section for an explanation of the Pro-forma non-GAAP financial measure.