Xerox 2010 Annual Report Download - page 53
Download and view the complete annual report
Please find page 53 of the 2010 Xerox annual report below. You can navigate through the pages in the report by either clicking on the pages listed below, or by using the keyword search tool below to find specific information within the annual report.-
 1
1 -
2
-
3
-
4
-
5
-
6
-
7
-
8
-
9
-
10
-
11
-
12
-
13
-
14
-
15
-
16
-
17
-
18
-
19
-
20
-
21
-
22
-
23
-
24
-
25
-
26
-
27
-
28
-
29
-
30
-
31
-
32
-
33
-
34
-
35
-
36
-
37
-
38
-
39
-
40
-
41
-
42
-
 43
43 -
 44
44 -
 45
45 -
 46
46 -
 47
47 -
 48
48 -
 49
49 -
 50
50 -
 51
51 -
 52
52 -
 53
53 -
 54
54 -
 55
55 -
 56
56 -
 57
57 -
 58
58 -
 59
59 -
 60
60 -
 61
61 -
 62
62 -
 63
63 -
64
-
65
-
66
-
67
-
68
-
69
-
70
-
71
-
72
-
73
-
74
-
75
-
76
-
77
-
78
-
79
-
80
-
81
-
82
-
83
-
84
-
85
-
86
-
87
-
88
-
89
-
90
-
91
-
92
-
93
-
94
-
95
-
96
-
97
-
98
-
99
-
100
-
101
-
102
-
103
-
104
-
105
-
106
-
107
-
108
-
109
-
110
-
111
-
112
 |
 |

51Xerox 2010 Annual Report
Management’s Discussion
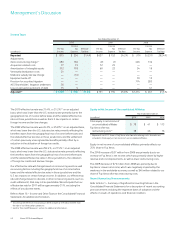
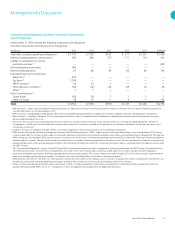
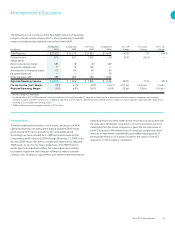
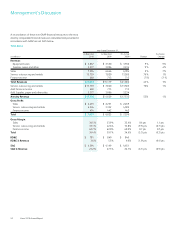
The following is a reconciliation of the Non-GAAP measure of Operating
margin to Pre-tax income margin, which is the most directly comparable
measure calculated and presented in accordance with GAAP.
As Reported As Reported Pro-forma As Reported '10 vs. '09 Pro-forma '09 vs. '08
(in millions) 2010 2009 2009(1) 2008 Change Change Change
Total Revenues $ 21,633 $ 15,179 $ 21,082 $ 17,608 43% 3% (14)%
Pre-tax Income 815 627 1,267 (79) 30% (36)% *
Adjustments:
Xerox restructuring charge 483 (8) (8) 429
Acquisition-related costs 77 72 104 —
Amortization of intangible assets 312 60 60 54
Equipment write-off — — — 39
Other expenses, net(2) 389 285 382 1,033
Adjusted Operating Income $ 2,076 $ 1,036 $ 1,805 $ 1,476 100% 15% (30)%
Pre-tax Income (Loss) Margin 3.8% 4.1% 6.0% (0.4)% (0.3) pts (2.2) pts 4.5 pts
Adjusted Operating Margin 9.6% 6.8% 8.6% 8.4% 2.8 pts 1.0 pts (1.6) pts
* Percent change not meaningful.
(1) Pro-forma reflects ACS’s 2009 estimated results from February 6 through December 31 adjusted to reflect fair value adjustments related to property, equipment and computer
software as well as customer contract costs. In addition, adjustments were made for deferred revenue, exited businesses, certain non-recurring product sales and other material non-
recurring costs associated with the acquisition.
(2) 2008 includes provision for litigation matters of $774 million.
Pro-forma Basis
To better understand the trends in our business, we discuss our 2010
operating results by comparing them against adjusted 2009 results
which include ACS historical results for the comparable period.
Accordingly, we have included ACS’s 2009 estimated results for the
comparable period February 6, 2009 through December 31, 2009 in our
reported 2009 results. We refer to comparisons against these adjusted
2009 results as “pro-forma” basis comparisons. ACS 2009 historical
results have been adjusted to reflect fair value adjustments related
to property, equipment and computer software as well as customer
contract costs. In addition, adjustments were made for deferred revenue,
exited businesses and other material non-recurring costs associated with
the acquisition. We believe comparisons on a pro-forma basis are more
meaningful than the actual comparisons, given the size and nature of
the ACS acquisition. We believe the pro-forma basis comparisons allow
investors to have better understanding and additional perspective of
the expected trends in our business as well as the impact of the ACS
acquisition on the Company’s operations.