Xerox 2010 Annual Report Download - page 81
Download and view the complete annual report
Please find page 81 of the 2010 Xerox annual report below. You can navigate through the pages in the report by either clicking on the pages listed below, or by using the keyword search tool below to find specific information within the annual report.-
 1
1 -
2
-
3
-
4
-
5
-
6
-
7
-
8
-
9
-
10
-
11
-
12
-
13
-
14
-
15
-
16
-
17
-
18
-
19
-
20
-
21
-
22
-
23
-
24
-
25
-
26
-
27
-
28
-
29
-
30
-
31
-
32
-
33
-
34
-
35
-
36
-
37
-
38
-
39
-
40
-
41
-
42
-
43
-
44
-
45
-
46
-
47
-
48
-
49
-
50
-
51
-
52
-
53
-
54
-
55
-
56
-
57
-
58
-
59
-
60
-
61
-
62
-
63
-
64
-
65
-
66
-
67
-
68
-
69
-
70
-
 71
71 -
 72
72 -
 73
73 -
 74
74 -
 75
75 -
 76
76 -
 77
77 -
 78
78 -
 79
79 -
 80
80 -
 81
81 -
 82
82 -
 83
83 -
 84
84 -
 85
85 -
 86
86 -
 87
87 -
 88
88 -
 89
89 -
 90
90 -
 91
91 -
92
-
93
-
94
-
95
-
96
-
97
-
98
-
99
-
100
-
101
-
102
-
103
-
104
-
105
-
106
-
107
-
108
-
109
-
110
-
111
-
112
 |
 |

Notes to the Consolidated
Financial Statements
Dollars in millions, except per-share data and unless otherwise indicated.
79Xerox 2010 Annual Report
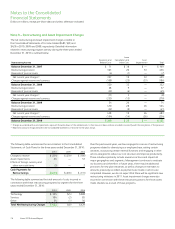
In addition, related to these activities, we also recorded lease cancellation
and other costs of $19 and asset impairment charges of $53. The lease
termination and asset impairment charges primarily related to: (i) the
relocation of certain manufacturing operations including the closing of our
toner plant in Oklahoma City and the consolidation of our manufacturing
operations in Ireland; and (ii) the exit from certain leased and owned
facilities as a result of the actions noted above.
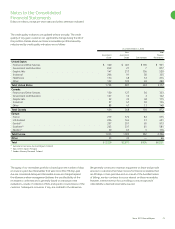
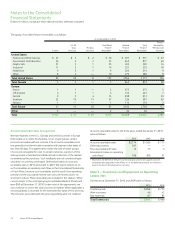
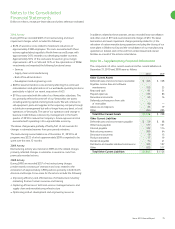
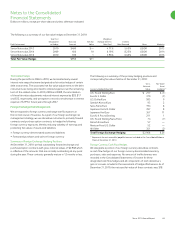
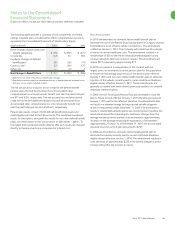
Note 10 – Supplementary Financial Information
The components of other current assets and other current liabilities at
December 31, 2010 and 2009 were as follows:
2010 2009
Other Current Assets
Deferred taxes and income taxes receivable $ 345 $ 328
Royalties, license fees and software
maintenance 155 23
Restricted cash 91 31
Prepaid expenses 133 86
Derivative instruments 45 16
Deferred purchase price from sale
of receivables 90 —
Advances and deposits 23 19
Other 244 205
Total Other Current Assets $ 1,126 $ 708
Other Current Liabilities
Deferred taxes and income taxes payable $ 59 $ 68
Other taxes payable 177 161
Interest payable 122 114
Restructuring reserves 309 64
Derivative instruments 19 15
Product warranties 17 19
Dividends payable 74 41
Distributor and reseller rebates/commissions 105 127
Other 925 517
Total Other Current Liabilities $ 1,807 $ 1,126
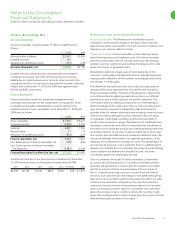
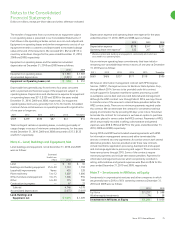
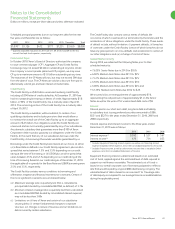
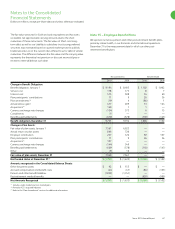
2010 Activity
During 2010, we recorded $483 of net restructuring and asset
impairment charges, which included the following:
$470 of severance costs related to headcount reductions of
•
approximately 9,000 employees. The costs associated with these
actions applied about equally to North America and Europe, with
approximately 20% related to our developing market countries.
Approximately 50% of the costs were focused on gross margin
improvements, 40% on SAG and 10% on the optimization of RD&E
investments and impacted the following functional areas:
– Services
– Supply chain and manufacturing
– Back-office administration
– Development and engineering costs.
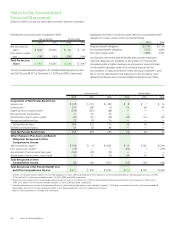
$28 for lease termination costs primarily reflecting the continued
•
rationalization and optimization of our worldwide operating locations,
particularly in light of our recent acquisition of ACS.
$19 loss associated with the sale of our Venezuelan subsidiary. The
•
loss primarily reflects the write-off of our Venezuelan net assets
including working capital and long-lived assets. We will continue to
sell equipment, parts and supplies to the acquiring company through
a distribution arrangement but will no longer have any direct or local
operations in Venezuela. The sale of our operations and change in
business model follows a decision by management in the fourth
quarter of 2010 to reduce the Company’s future exposure and risk
associated with operating in this unpredictable economy.
The above charges were partially offset by $41 of net reversals for
changes in estimated reserves from prior period initiatives.
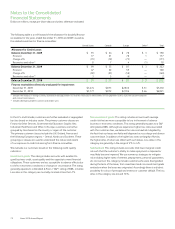
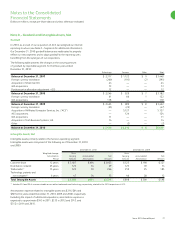
The restructuring reserve balance as of December 31, 2010 for all
programs was $323, of which approximately $309 is expected to be
spent over the next 12 months.
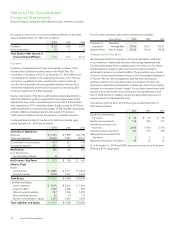
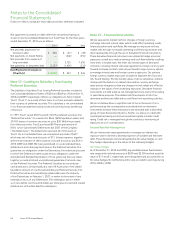
2009 Activity
Restructuring activity was minimal in 2009 and the related charges
primarily reflected changes in estimates in severance costs from
previously recorded actions.
2008 Activity
During 2008, we recorded $357 of net restructuring charges
predominantly consisting of severance and costs related to the
elimination of approximately 4,900 positions primarily in both North
America and Europe. Focus areas for the actions include the following:
Improving efficiency and effectiveness of infrastructure including:
•
marketing, finance, human resources and training
Capturing efficiencies in technical services, managed services, and
•
supply chain and manufacturing infrastructure
Optimizing product development and engineering resources.
•