Xerox 2010 Annual Report Download - page 29
Download and view the complete annual report
Please find page 29 of the 2010 Xerox annual report below. You can navigate through the pages in the report by either clicking on the pages listed below, or by using the keyword search tool below to find specific information within the annual report.-
 1
1 -
2
-
3
-
4
-
5
-
6
-
7
-
8
-
9
-
10
-
11
-
12
-
13
-
14
-
15
-
16
-
17
-
18
-
 19
19 -
 20
20 -
 21
21 -
 22
22 -
 23
23 -
 24
24 -
 25
25 -
 26
26 -
 27
27 -
 28
28 -
 29
29 -
 30
30 -
 31
31 -
 32
32 -
 33
33 -
 34
34 -
 35
35 -
 36
36 -
 37
37 -
 38
38 -
 39
39 -
40
-
41
-
42
-
43
-
44
-
45
-
46
-
47
-
48
-
49
-
50
-
51
-
52
-
53
-
54
-
55
-
56
-
57
-
58
-
59
-
60
-
61
-
62
-
63
-
64
-
65
-
66
-
67
-
68
-
69
-
70
-
71
-
72
-
73
-
74
-
75
-
76
-
77
-
78
-
79
-
80
-
81
-
82
-
83
-
84
-
85
-
86
-
87
-
88
-
89
-
90
-
91
-
92
-
93
-
94
-
95
-
96
-
97
-
98
-
99
-
100
-
101
-
102
-
103
-
104
-
105
-
106
-
107
-
108
-
109
-
110
-
111
-
112
 |
 |

27Xerox 2010 Annual Report
Management’s Discussion
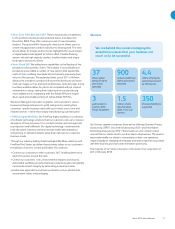
The following is a summary of key 2010 highlights:
Exceeded on earnings and cash generation commitments
•
Strong services performance, realizing benefits from the ACS
•
acquisition
Technology revenue and activity growth; innovative products
•
launched in key segments
Disciplined cost and expense management yielding operating
•
margin improvement
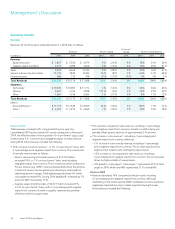
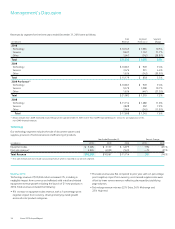
We completed the acquisition of ACS on February 5, 2010, and its results
subsequent to that date are included in our results. Total revenue of
$21.6 billion in 2010 increased 43% from the prior year, primarily as a
result of the ACS acquisition. Currency had a negligible impact on 2010
total revenues. In order to provide a clearer comparison of our results
to the prior year, we are also providing a discussion and analysis on a
pro-forma basis, where we include ACS’s 2009 estimated results from
February 6 through December 31 in our historical 2009 results(1). On
a pro-forma(1) basis, total revenue increased 3% in 2010, including a
negligible impact from currency.
2010 Annuity Revenue(2) increased 53% from the prior year, or 1%
on a pro-forma(1) basis. Currency had a 1-percentage point unfavorable
impact on pro-forma annuity revenue. 2010 Equipment Revenue
increased 9% from the prior year, including a 1-percentage point
negative impact from currency.
Net income attributable to Xerox for 2010 was $606 million and
included $690 million of after-tax costs and expenses related to
restructuring, intangibles amortization, acquisition-related costs and
other discrete and unusual items. Net income attributable to Xerox for
2009 was $485 million and included $128 million of similar after-tax
costs and expenses.
Cash flow from operations was $2.7 billion for 2010, primarily as a
result of increased earnings and working capital cash generation. Cash
used in investing activities of $2.2 billion primarily reflects the net
cash consideration of $1.5 billion for the ACS acquisition. Cash used in
financing activities was $3.1 billion, primarily reflecting the repayment of
ACS’s debt of $1.7 billion as well as net payments on other debt during
2010, including the early redemption of $660 million of debt.
Our 2011 priorities include:
Strengthening our leadership in Technology through competitively
•
advantaged products and increased distribution
Accelerating our services business – capture significant BPO
•
opportunity and continue improvements in ITO and document
outsourcing
Continued cost and expense discipline to enable operating margin
•
expansion
Driving cash flow, reducing debt and returning cash to shareholders
•
Our 2011 balance sheet and cash flow strategy includes: sustaining our
working capital improvements; continued reductions in non-financing
debt; leveraging of our financing assets (finance receivables and
equipment on operating leases); achieving an optimal cost of capital;
and effectively deploying cash to maximize shareholder value through
share repurchase, acquisitions and dividends.
In addition, as a result of providing lease equipment financing to our
customers, we expect to continue to make investments in lease contracts
(finance receivables and equipment on operating leases). Since we
maintain a certain level of debt to support this investment, we expect to
continue to leverage this investment in 2011 (see “Customer Financing
Activities” for additional information).
(1) The pro-forma information included within this MD&A is different from the pro-forma
information provided in Note 3 – Acquisitions. The pro-forma information included
in Note 3 presents the combined results for 2010 and 2009 as if the acquisition
was completed January 1st of each respective year. See the “Non-GAAP Financial
Measures” section for a further explanation and discussion of this non-GAAP measure.
(2) Annuity revenue = Service, outsourcing and rentals + Supplies, paper and other sales +
Finance income.
Currency Impacts
To understand the trends in our business, we believe that it is helpful to
analyze the impact of changes in the translation of foreign currencies
into U.S. Dollars on revenues and expenses. We refer to this analysis
as “currency impact” or “the impact from currency." This impact is
calculated by translating current-period activity in local currency using
the comparable prior-year period’s currency translation rate. This
impact is calculated for all countries where the functional currency is
the local-country currency. Revenues and expenses from our developing
market countries (Latin America, Brazil, the Middle East, India, Eurasia
and Central-Eastern Europe) are analyzed at actual exchange rates for
all periods presented, since these countries generally have unpredictable
currency and inflationary environments, and our operations in these
countries have historically implemented pricing actions to recover the
impact of inflation and devaluation. We do not hedge the translation
effect of revenues or expenses denominated in currencies where the
local currency is the functional currency.
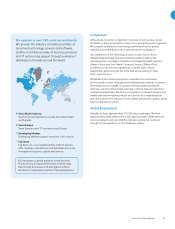
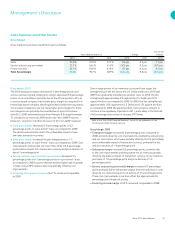
Approximately 36% of our consolidated revenues are derived from
operations outside of the United States where the U.S. Dollar is not the
functional currency. When compared with the average of the major
European currencies and Canadian Dollar on a revenue-weighted basis,
the U.S. Dollar was 2% stronger in 2010 and 7% stronger in 2009, each
compared to the prior year. As a result, the foreign currency translation
impact on revenue was negligible in 2010 and a 3% detriment in 2009.
Refer to the “Gross Margin” section for additional information regarding
the impact of currency on our product costs.