Xerox 2010 Annual Report Download - page 79
Download and view the complete annual report
Please find page 79 of the 2010 Xerox annual report below. You can navigate through the pages in the report by either clicking on the pages listed below, or by using the keyword search tool below to find specific information within the annual report.-
 1
1 -
2
-
3
-
4
-
5
-
6
-
7
-
8
-
9
-
10
-
11
-
12
-
13
-
14
-
15
-
16
-
17
-
18
-
19
-
20
-
21
-
22
-
23
-
24
-
25
-
26
-
27
-
28
-
29
-
30
-
31
-
32
-
33
-
34
-
35
-
36
-
37
-
38
-
39
-
40
-
41
-
42
-
43
-
44
-
45
-
46
-
47
-
48
-
49
-
50
-
51
-
52
-
53
-
54
-
55
-
56
-
57
-
58
-
59
-
60
-
61
-
62
-
63
-
64
-
65
-
66
-
67
-
68
-
 69
69 -
 70
70 -
 71
71 -
 72
72 -
 73
73 -
 74
74 -
 75
75 -
 76
76 -
 77
77 -
 78
78 -
 79
79 -
 80
80 -
 81
81 -
 82
82 -
 83
83 -
 84
84 -
 85
85 -
 86
86 -
 87
87 -
 88
88 -
 89
89 -
90
-
91
-
92
-
93
-
94
-
95
-
96
-
97
-
98
-
99
-
100
-
101
-
102
-
103
-
104
-
105
-
106
-
107
-
108
-
109
-
110
-
111
-
112
 |
 |

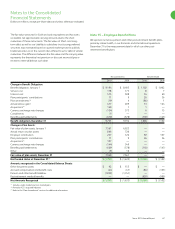
Notes to the Consolidated
Financial Statements
Dollars in millions, except per-share data and unless otherwise indicated.
77Xerox 2010 Annual Report
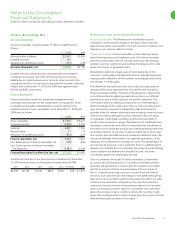
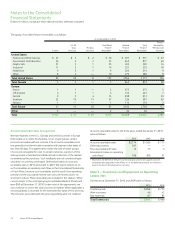
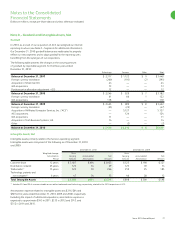
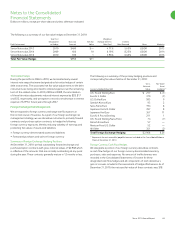
Technology Services Other Total
Balance at December 31, 2007 $ 2,317 $ 1,122 $ 9 $ 3,448
Foreign currency translation (200) (193) (2) (395)
Acquisition of Veenman B.V. 44 — — 44
GIS acquisitions 73 — — 73
Purchase price allocation adjustment – GIS 12 — — 12
Balance at December 31, 2008 $ 2,246 $ 929 $ 7 $ 3,182
Foreign currency translation 61 60 1 122
GIS acquisitions 118 — — 118
Balance at December 31, 2009 $ 2,425 $ 989 $ 8 $ 3,422
Foreign currency translation (25) (22) — (47)
Acquisition of Affiliated Computer Services, Inc. (“ACS”) — 5,127 — 5,127
ACS acquisitions — 124 — 124
GIS acquisitions 11 — — 11
Acquisition of Irish Business Systems, Ltd. 14 — — 14
Other — (2) — (2)
Balance at December 31, 2010 $ 2,425 $ 6,216 $ 8 $ 8,649
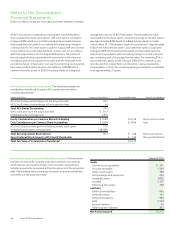
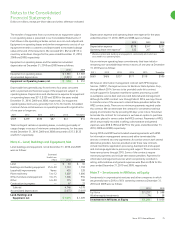
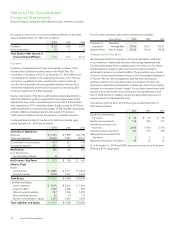
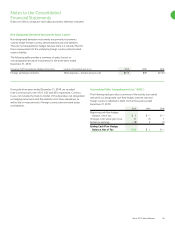
Intangible Assets, Net
Intangible assets primarily relate to the Services operating segment.
Intangible assets were comprised of the following as of December 31, 2010
and 2009:
December 31, 2010 December 31, 2009
Weighted Average Gross Gross
Amortization Carrying Accumulated Net Carrying Accumulated Net
Period Amount Amortization Amount Amount Amortization Amount
Customer base 12 years $ 3,487 $ 464 $ 3,023 $ 525 $ 198 $ 327
Distribution network 25 years 123 54 69 123 49 74
Trademarks(1) 15 years 325 59 266 210 25 185
Technology, patents and
non-compete(1) 6 years 47 34 13 40 28 12
Total Intangible Assets
$ 3,982 $ 611 $ 3,371 $ 898 $ 300 $ 598
(1) Includes $10 and $5 of non-amortizable assets within trademarks and technology, respectively, related to the 2010 acquisition of ACS.
Amortization expense related to intangible assets was $316, $64 and
$58 for the years ended December 31, 2010, 2009 and 2008, respectively.
Excluding the impact of additional acquisitions, amortization expense is
expected to approximate $345 in 2011, $335 in 2012 and 2013, and
$312 in 2014 and 2015.
Note 8 – Goodwill and Intangible Assets, Net
Goodwill
In 2010, as a result of our acquisition of ACS, we realigned our internal
reporting structure (see Note 2 – Segments for additional information).
Our December 31, 2010 goodwill balance was reallocated to properly
reflect our new segments and to align goodwill to the reporting units
benefiting from the synergies of our acquisitions.
The following table presents the changes in the carrying amount
of goodwill, by reportable segment, for the three years ended
December 31, 2010: