Xerox 2010 Annual Report Download - page 59
Download and view the complete annual report
Please find page 59 of the 2010 Xerox annual report below. You can navigate through the pages in the report by either clicking on the pages listed below, or by using the keyword search tool below to find specific information within the annual report.-
 1
1 -
2
-
3
-
4
-
5
-
6
-
7
-
8
-
9
-
10
-
11
-
12
-
13
-
14
-
15
-
16
-
17
-
18
-
19
-
20
-
21
-
22
-
23
-
24
-
25
-
26
-
27
-
28
-
29
-
30
-
31
-
32
-
33
-
34
-
35
-
36
-
37
-
38
-
39
-
40
-
41
-
42
-
43
-
44
-
45
-
46
-
47
-
48
-
 49
49 -
 50
50 -
 51
51 -
 52
52 -
 53
53 -
 54
54 -
 55
55 -
 56
56 -
 57
57 -
 58
58 -
 59
59 -
 60
60 -
 61
61 -
 62
62 -
 63
63 -
 64
64 -
 65
65 -
 66
66 -
 67
67 -
 68
68 -
 69
69 -
70
-
71
-
72
-
73
-
74
-
75
-
76
-
77
-
78
-
79
-
80
-
81
-
82
-
83
-
84
-
85
-
86
-
87
-
88
-
89
-
90
-
91
-
92
-
93
-
94
-
95
-
96
-
97
-
98
-
99
-
100
-
101
-
102
-
103
-
104
-
105
-
106
-
107
-
108
-
109
-
110
-
111
-
112
 |
 |

57Xerox 2010 Annual Report
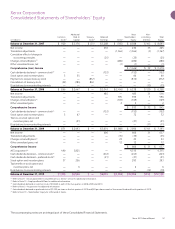
Xerox Corporation
Consolidated Statements of Shareholders’ Equity
Additional Xerox Non-
Common Paid-In Treasury Retained Shareholders’ controlling Total
(in millions) Stock(6) Capital Stock(6) Earnings AOCL(1) Equity Interests Equity
Balance at December 31, 2007 $ 920 $ 3,176 $ (31) $ 5,288 $ (765) $ 8,588 $ 103 $ 8,691
Net income — — — 230 — 230 35 265
Translation adjustments — — — — (1,364) (1,364) (3) (1,367)
Cumulative effect of change in
accounting principles — — — (25) — (25) — (25)
Changes in benefit plans(2) — — — — (286) (286) — (286)
Other unrealized losses, net — — — — (1) (1) — (1)
Comprehensive (Loss) Income $ (1,446) $ 32 $ (1,414)
Cash dividends declared – common stock(3) — — — (152) — (152) — (152)
Stock option and incentive plans 5 55 — — — 60 — 60
Payments to acquire treasury stock — — (812) — — (812) — (812)
Cancellation of treasury stock (59) (784) 843 — — — — —
Distributions to noncontrolling interests — — — — — — (15) (15)
Balance at December 31, 2008 $ 866 $ 2,447 $ — $ 5,341 $ (2,416) $ 6,238 $ 120 $ 6,358
Net income — — — 485 — 485 31 516
Translation adjustments — — — — 595 595 1 596
Changes in benefit plans(2) — — — — (169) (169) — (169)
Other unrealized gains — — — — 2 2 — 2
Comprehensive Income $ 913 $ 32 $ 945
Cash dividends declared – common stock
(3) — — — (152) — (152) — (152)
Stock option and incentive plans 5 67 — — — 72 — 72
Tax loss on stock option and
incentive plans, net — (21) — — — (21) — (21)
Distributions to noncontrolling interests — — — — — — (11) (11)
Balance at December 31, 2009 $ 871 $ 2,493 $ — $ 5,674 $ (1,988) $ 7,050 $ 141 $ 7,191
Net income — — — 606 — 606 31 637
Translation adjustments — — — — (35) (35) — (35)
Changes in benefit plans(2) — — — — 23 23 — 23
Other unrealized gains, net — — — — 12 12 — 12
Comprehensive Income $ 606 $ 31 $ 637
ACS acquisition(4) 490 3,825 — — — 4,315 — 4,315
Cash dividends declared – common stock(3) — — — (243) — (243) — (243)
Cash dividends declared – preferred stock(5) — — — (21) — (21) — (21)
Stock option and incentive plans 37 256 — — — 293 — 293
Tax benefit on stock option and
incentive plans, net — 6 — — — 6 — 6
Distributions to noncontrolling interests — — — — — — (19) (19)
Balance at December 31, 2010 $ 1,398 $ 6,580 $ — $ 6,016 $ (1,988) $ 12,006 $ 153 $ 12,159
(1) Refer to Note 1 “Accumulated Other Comprehensive Loss (AOCL)” section for additional information.
(2) Refer to Note 15 – Employee Benefit Plans for additional information.
(3) Cash dividends declared on common stock of $0.0425 in each of the four quarters in 2008, 2009 and 2010.
(4) Refer to Note 3 – Acquisitions for additional information.
(5) Cash dividends declared on preferred stock of $12.22 per share in the first quarter of 2010 and $20 per share in each of the second, third and fourth quarters of 2010.
(6) Refer to Note 19 – Shareholders’ Equity for rollforward of shares.
The accompanying notes are an integral part of these Consolidated Financial Statements.