Xerox 2010 Annual Report Download - page 34
Download and view the complete annual report
Please find page 34 of the 2010 Xerox annual report below. You can navigate through the pages in the report by either clicking on the pages listed below, or by using the keyword search tool below to find specific information within the annual report.-
 1
1 -
2
-
3
-
4
-
5
-
6
-
7
-
8
-
9
-
10
-
11
-
12
-
13
-
14
-
15
-
16
-
17
-
18
-
19
-
20
-
21
-
22
-
23
-
 24
24 -
 25
25 -
 26
26 -
 27
27 -
 28
28 -
 29
29 -
 30
30 -
 31
31 -
 32
32 -
 33
33 -
 34
34 -
 35
35 -
 36
36 -
 37
37 -
 38
38 -
 39
39 -
 40
40 -
 41
41 -
 42
42 -
 43
43 -
 44
44 -
45
-
46
-
47
-
48
-
49
-
50
-
51
-
52
-
53
-
54
-
55
-
56
-
57
-
58
-
59
-
60
-
61
-
62
-
63
-
64
-
65
-
66
-
67
-
68
-
69
-
70
-
71
-
72
-
73
-
74
-
75
-
76
-
77
-
78
-
79
-
80
-
81
-
82
-
83
-
84
-
85
-
86
-
87
-
88
-
89
-
90
-
91
-
92
-
93
-
94
-
95
-
96
-
97
-
98
-
99
-
100
-
101
-
102
-
103
-
104
-
105
-
106
-
107
-
108
-
109
-
110
-
111
-
112
 |
 |
32
Management’s Discussion
Xerox 2010 Annual Report
Assuming settlement losses in 2011 are consistent with 2010, our
2011 net periodic defined benefit pension cost is expected to be
approximately $30 million lower than 2010, primarily driven by the
U.S. as a result of a reduction in the amortization of actuarial losses
and an increase in expected asset returns from higher asset values and
expected contributions to the plan. Our 2011 retiree health benefit cost
is expected to be approximately $17 million lower than 2010, primarily
as a result of amendments to the U.S. plan in 2010.
Benefit plan costs are included in several income statement components
based on the related underlying employee costs. Pension and retiree
health benefit plan assumptions are included in Note 15 – Employee
Benefit Plans in the Consolidated Financial Statements. Holding all other
assumptions constant, a 0.25% increase or decrease in the discount
rate would change the 2011 projected net periodic pension cost by $17
million. Likewise, a 0.25% increase or decrease in the expected return on
plan assets would change the 2011 projected net periodic pension cost
by $17 million.
IncomeTaxesandTaxValuationAllowances
We record the estimated future tax effects of temporary differences
between the tax bases of assets and liabilities and amounts reported in
our Consolidated Balance Sheets, as well as operating loss and tax credit
carryforwards. We follow very specific and detailed guidelines in each
tax jurisdiction regarding the recoverability of any tax assets recorded in
our Consolidated Balance Sheets and provide valuation allowances as
required. We regularly review our deferred tax assets for recoverability
considering historical profitability, projected future taxable income, the
expected timing of the reversals of existing temporary differences and
tax planning strategies. If we continue to operate at a loss in certain
jurisdictions or are unable to generate sufficient future taxable income,
or if there is a material change in the actual effective tax rates or time
period within which the underlying temporary differences become
taxable or deductible, we could be required to increase the valuation
allowance against all or a significant portion of our deferred tax assets
resulting in a substantial increase in our effective tax rate and a material
adverse impact on our operating results. Conversely, if and when our
operations in some jurisdictions become sufficiently profitable to
recover previously reserved deferred tax assets, we would reduce all or a
portion of the applicable valuation allowance in the period when such
determination is made. This would result in an increase to reported
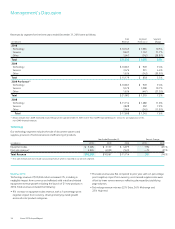
earnings in such period. Adjustments to our valuation allowance,
through charges (credits) to income tax expense, were $22 million, $(11)
million and $17 million for the years ended December 31, 2010, 2009
and 2008, respectively. There were other (decreases) increases to our
valuation allowance, including the effects of currency, of $11 million,
$55 million and $(136) million for the years ended December 31, 2010,
2009 and 2008, respectively. These did not affect income tax expense
in total, as there was a corresponding adjustment to deferred tax assets
or other comprehensive income. Gross deferred tax assets of $3.8 billion
and $3.7 billion had valuation allowances of $735 million and $672
million at December 31, 2010 and 2009, respectively.
We used a weighted average expected rate of return on plan assets of
7.3% for 2010, 7.4% for 2009 and 7.6% for 2008, on a worldwide basis.
During 2010, the actual return on plan assets was $846 million, reflecting
an improvement in the equity markets during the year. When estimating
the 2011 expected rate of return, in addition to assessing recent
performance, we considered the historical returns earned on plan assets,
the rates of return expected in the future and our investment strategy
and asset mix with respect to the plans’ funds. The weighted average
expected rate of return on plan assets we will use in 2011 is 7.2%.
For purposes of determining the expected return on plan assets, we use
a calculated value approach to determine the value of the pension plan
assets, rather than a fair market value approach. The primary difference
between these two methods relates to a systematic recognition of
changes in fair value over time (generally two years) versus immediate
recognition of changes in fair value. Our expected rate of return on plan
assets is applied to the calculated asset value to determine the amount
of the expected return on plan assets to be used in the determination
of the net periodic pension cost. The calculated value approach reduces
the volatility in net periodic pension cost that can result from using the
fair market value approach. The difference between the actual return
on plan assets and the expected return on plan assets is added to,
or subtracted from, any cumulative differences from prior years. This
amount is a component of the net actuarial gain or loss.
Another significant assumption affecting our pension and retiree health
benefit obligations and the net periodic benefit cost is the rate that we
use to discount our future anticipated benefit obligations. The discount
rate reflects the current rate at which the benefit liabilities could be
effectively settled considering the timing of expected payments for plan
participants. In estimating this rate, we consider rates of return on high-
quality fixed-income investments included in published bond indices,
adjusted to eliminate the effects of call provisions and differences in
the timing and amounts of cash outflows related to the bonds. In the
U.S. and the U.K., which comprise approximately 75% of our projected
benefit obligations, we consider the Moody’s Aa Corporate Bond Index
and the International Index Company’s iBoxx Sterling Corporate AA
Cash Bond Index, respectively, in the determination of the appropriate
discount rate assumptions. The weighted average discount rate we used
to measure our pension obligations as of December 31, 2010 and to
calculate our 2011 expense was 5.2%, which is lower than 5.7% that
was used to calculate our 2010 expense. The weighted average discount
rate we used to measure our retiree health obligation as of December
31, 2010 and to calculate our 2011 expense was 4.9%, which is lower
than 5.4% that was used to calculate our 2010 expense.
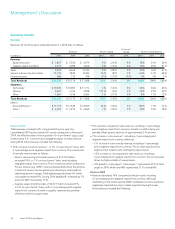
On a consolidated basis, we recognized net periodic pension cost
of $355 million, $270 million and $254 million for the years ended
December 31, 2010, 2009 and 2008, respectively. The costs associated
with our defined contribution plans, which are included in net periodic
pension cost, were $51 million, $38 million and $80 million for the years
ended December 31, 2010, 2009 and 2008, respectively. The increase in
2010 was primarily due to our partial resumption of the 401(k) match in
the U.S. On a consolidated basis, we recognized net retiree health benefit
cost of $32 million, $26 million and $77 million for the years ended
December 31, 2010, 2009 and 2008, respectively.