Xerox 2010 Annual Report Download - page 68
Download and view the complete annual report
Please find page 68 of the 2010 Xerox annual report below. You can navigate through the pages in the report by either clicking on the pages listed below, or by using the keyword search tool below to find specific information within the annual report.-
 1
1 -
2
-
3
-
4
-
5
-
6
-
7
-
8
-
9
-
10
-
11
-
12
-
13
-
14
-
15
-
16
-
17
-
18
-
19
-
20
-
21
-
22
-
23
-
24
-
25
-
26
-
27
-
28
-
29
-
30
-
31
-
32
-
33
-
34
-
35
-
36
-
37
-
38
-
39
-
40
-
41
-
42
-
43
-
44
-
45
-
46
-
47
-
48
-
49
-
50
-
51
-
52
-
53
-
54
-
55
-
56
-
57
-
 58
58 -
 59
59 -
 60
60 -
 61
61 -
 62
62 -
 63
63 -
 64
64 -
 65
65 -
 66
66 -
 67
67 -
 68
68 -
 69
69 -
 70
70 -
 71
71 -
 72
72 -
 73
73 -
 74
74 -
 75
75 -
 76
76 -
 77
77 -
 78
78 -
79
-
80
-
81
-
82
-
83
-
84
-
85
-
86
-
87
-
88
-
89
-
90
-
91
-
92
-
93
-
94
-
95
-
96
-
97
-
98
-
99
-
100
-
101
-
102
-
103
-
104
-
105
-
106
-
107
-
108
-
109
-
110
-
111
-
112
 |
 |

Notes to the Consolidated
Financial Statements
Dollars in millions, except per-share data and unless otherwise indicated.
66 Xerox 2010 Annual Report
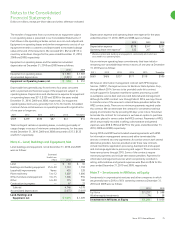
Document outsourcing services include service arrangements that allow
customers to streamline, simplify and digitize their document-intensive
business processes through automation and deployment of software
applications and tools and the management of their printing needs.
Business process outsourcing services include service arrangements
where we manage a customer’s business activity or process. Information
technology outsourcing services include service arrangements where
we manage a customer’s IT-related activities, such as application
management and application development, data center operations or
testing and quality assurance.
The segment classified as Other includes several units, none of which
meets the threshold for separate segment reporting. This group primarily
includes Xerox Supplies Business Group (predominantly paper sales),
Wide Format Systems, licensing revenues, GIS network integration
solutions and electronic presentation systems, non-allocated Corporate
items including non-financing interest, as well as other items included in
Other expenses, net.
Our Technology segment is centered on strategic product groups, which
share common technology, manufacturing and product platforms. This
segment includes the sale of document systems and supplies, technical
services and product financing. Our products range from:
“Entry,” which includes A4 devices and desktop printers.
•
“Mid-range,” which includes A3 devices that generally serve
•
workgroup environments in mid to large enterprises. Mid-range
includes products that fall into the following market categories:
Color 41+ ppm priced at less than $100K and Light Production
91+ppm priced at less than $100K.
“High-end,” which includes production printing and publishing
•
systems that generally serve the graphic communications marketplace
and large enterprises.
The Services segment comprises three outsourcing service offerings:
Document Outsourcing (which includes Managed Print Services)
•
Business Process Outsourcing
•
Information Technology Outsourcing.
•
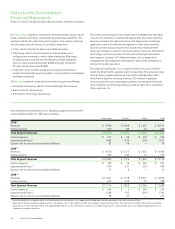
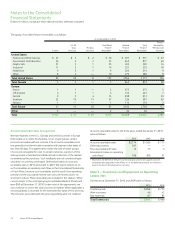
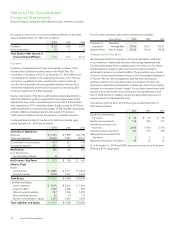
Selected financial information for our Operating segments for the three
years ended December 31, 2010 was as follows:
Technology Services Other Total
2010(1)
Revenues $ 9,790 $ 9,548 $ 1,635 $ 20,973
Finance income 559 89 12 660
Total Segment Revenues $ 10,349 $ 9,637 $ 1,647 $ 21,633
Interest expense $ 212 $ 28 $ 352 $ 592
Segment profit (loss)(2) 1,085 1,132 (342) 1,875
Equity in net income of unconsolidated affiliates 62 16 — 78
2009(1)
Revenues $ 9,470 $ 3,373 $ 1,623 $ 14,466
Finance income 597 103 13 713
Total Segment Revenues $ 10,067 $ 3,476 $ 1,636 $ 15,179
Interest expense $ 229 $ 36 $ 262 $ 527
Segment profit (loss)(2) 949 231 (342) 838
Equity in net income of unconsolidated affiliates 33 8 — 41
2008(1)
Revenues $ 11,041 $ 3,718 $ 2,051 $ 16,810
Finance income 673 110 15 798
Total Segment Revenues $ 11,714 $ 3,828 $ 2,066 $ 17,608
Interest expense $ 293 $ 5 $ 269 $ 567
Segment profit (loss)(2) 1,288 302 (245) 1,345
Equity in net income of unconsolidated affiliates 90 23 — 113
(1) Asset information on a segment basis is not disclosed as this information is not separately identified and internally reported to our chief executive officer.
(2) Depreciation and amortization expense, which is recorded in cost of sales, RD&E and SAG are included in segment profit above. This information is neither identified nor internally
reported to our chief executive officer. The separate identification of this information for purposes of segment disclosure is impracticable, as it is not readily available and the cost
to develop it would be excessive.