Xerox 2010 Annual Report Download - page 75
Download and view the complete annual report
Please find page 75 of the 2010 Xerox annual report below. You can navigate through the pages in the report by either clicking on the pages listed below, or by using the keyword search tool below to find specific information within the annual report.-
 1
1 -
2
-
3
-
4
-
5
-
6
-
7
-
8
-
9
-
10
-
11
-
12
-
13
-
14
-
15
-
16
-
17
-
18
-
19
-
20
-
21
-
22
-
23
-
24
-
25
-
26
-
27
-
28
-
29
-
30
-
31
-
32
-
33
-
34
-
35
-
36
-
37
-
38
-
39
-
40
-
41
-
42
-
43
-
44
-
45
-
46
-
47
-
48
-
49
-
50
-
51
-
52
-
53
-
54
-
55
-
56
-
57
-
58
-
59
-
60
-
61
-
62
-
63
-
64
-
 65
65 -
 66
66 -
 67
67 -
 68
68 -
 69
69 -
 70
70 -
 71
71 -
 72
72 -
 73
73 -
 74
74 -
 75
75 -
 76
76 -
 77
77 -
 78
78 -
 79
79 -
 80
80 -
 81
81 -
 82
82 -
 83
83 -
 84
84 -
 85
85 -
86
-
87
-
88
-
89
-
90
-
91
-
92
-
93
-
94
-
95
-
96
-
97
-
98
-
99
-
100
-
101
-
102
-
103
-
104
-
105
-
106
-
107
-
108
-
109
-
110
-
111
-
112
 |
 |

Notes to the Consolidated
Financial Statements
Dollars in millions, except per-share data and unless otherwise indicated.
73Xerox 2010 Annual Report
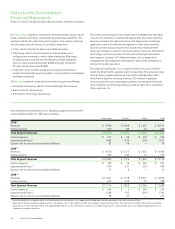
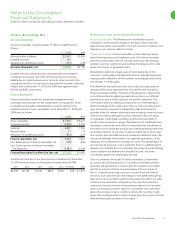
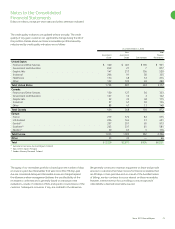
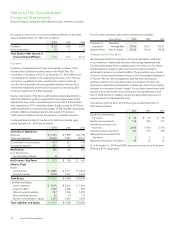
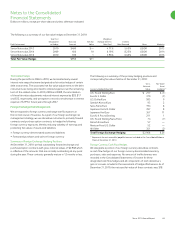
The credit quality indicators are updated at least annually. The credit
quality of any given customer can significantly change during the life of
the portfolio. Details about our finance receivables portfolio based by
industry and by credit quality indicators are as follows:
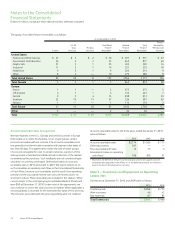
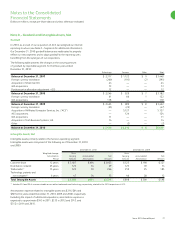
As of December 31, 2010
Non- Total
Investment investment Finance
Grade Grade Substandard Receivables
United States:
Finance and Other Services $ 360 $ 401 $ 190 $ 951
Government and Education 849 21 7 877
Graphic Arts 147 217 156 520
Industrial 206 91 38 335
Healthcare 134 48 32 214
Other 102 109 69 280
Total United States 1,798 887 492 3,177
Canada:
Finance and Other Services 150 127 56 333
Government and Education 127 12 3 142
Graphic Arts 32 35 48 115
Industrial 57 47 30 134
Other 88 47 13 148
Total Canada 454 268 150 872
Europe:
France 219 374 82 675
U.K./Ireland 206 164 51 421
Central(1) 297 551 65 913
Southern(2) 263 237 81 581
Nordics(3) 50 63 3 116
Total Europe 1,035 1,389 282 2,706
Other 33 33 — 66
Total $ 3,320 $ 2,577 $ 924 $ 6,821
(1) Switzerland, Germany, Austria, Belgium, Holland.
(2) Italy, Greece, Spain, Portugal.
(3) Sweden, Norway, Denmark, Finland.
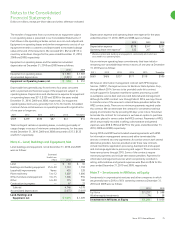
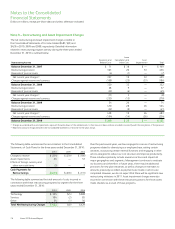
The aging of our receivables portfolio is based upon the number of days
an invoice is past due. Receivables that were more than 90 days past
due are considered delinquent. Receivable losses are charged against
the allowance when management believes the uncollectibility of the
receivable is confirmed and is generally based on individual credit
evaluations, results of collection efforts and specific circumstances of the
customer. Subsequent recoveries, if any, are credited to the allowance.
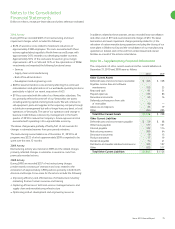
We generally continue to maintain equipment on lease and provide
services to customers that have invoices for finance receivables that
are 90 days or more past due and, as a result of the bundled nature
of billings, we also continue to accrue interest on those receivables.
However, interest revenue for such billings is only recognized if
collectability is deemed reasonably assured.