Xerox 2010 Annual Report Download - page 58
Download and view the complete annual report
Please find page 58 of the 2010 Xerox annual report below. You can navigate through the pages in the report by either clicking on the pages listed below, or by using the keyword search tool below to find specific information within the annual report.-
 1
1 -
2
-
3
-
4
-
5
-
6
-
7
-
8
-
9
-
10
-
11
-
12
-
13
-
14
-
15
-
16
-
17
-
18
-
19
-
20
-
21
-
22
-
23
-
24
-
25
-
26
-
27
-
28
-
29
-
30
-
31
-
32
-
33
-
34
-
35
-
36
-
37
-
38
-
39
-
40
-
41
-
42
-
43
-
44
-
45
-
46
-
47
-
 48
48 -
 49
49 -
 50
50 -
 51
51 -
 52
52 -
 53
53 -
 54
54 -
 55
55 -
 56
56 -
 57
57 -
 58
58 -
 59
59 -
 60
60 -
 61
61 -
 62
62 -
 63
63 -
 64
64 -
 65
65 -
 66
66 -
 67
67 -
 68
68 -
69
-
70
-
71
-
72
-
73
-
74
-
75
-
76
-
77
-
78
-
79
-
80
-
81
-
82
-
83
-
84
-
85
-
86
-
87
-
88
-
89
-
90
-
91
-
92
-
93
-
94
-
95
-
96
-
97
-
98
-
99
-
100
-
101
-
102
-
103
-
104
-
105
-
106
-
107
-
108
-
109
-
110
-
111
-
112
 |
 |

56 Xerox 2010 Annual Report
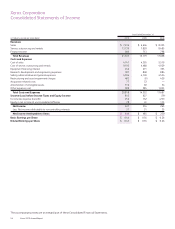
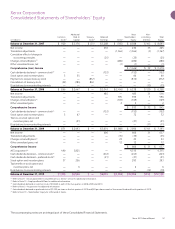
The accompanying notes are an integral part of these Consolidated Financial Statements.
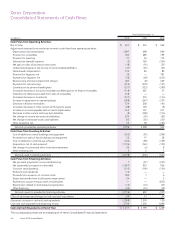
Xerox Corporation
Consolidated Statements of Cash Flows
Year Ended December 31,
(in millions) 2010 2009 2008
Cash Flows from Operating Activities:
Net income $ 637 $ 516 $ 265
Adjustments required to reconcile net income to cash flows from operating activities:
Depreciation and amortization 1,097 698 669
Provision for receivables 180 289 199
Provision for inventory 31 52 115
Deferred tax (benefit) expense (2) 120 (324)
Net gain on sales of businesses and assets (18) (16) (21)
Undistributed equity in net income of unconsolidated affiliates (37) (25) (53)
Stock-based compensation 123 85 85
Provision for litigation, net 36 — 781
Payments for litigation, net (36) (28) (615)
Restructuring and asset impairment charges 483 (8) 429
Payments for restructurings (213) (270) (131)
Contributions to pension benefit plans (237) (122) (299)
(Increase) decrease in accounts receivable and billed portion of finance receivables (118) 467 57
Collections of deferred proceeds from sales of receivables 218 — —
(Increase) decrease in inventories (151) 319 (114)
Increase in equipment on operating leases (288) (267) (331)
Decrease in finance receivables 129 248 164
(Increase) decrease in other current and long-term assets (98) 129 (8)
Increase in accounts payable and accrued compensation 615 157 211
Decrease in other current and long-term liabilities (9) (100) (174)
Net change in income tax assets and liabilities 229 (18) (92)
Net change in derivative assets and liabilities 85 (56) 230
Other operating, net 70 38 (104)
Net cash provided by operating activities 2,726 2,208 939
Cash Flows from Investing Activities:
Cost of additions to land, buildings and equipment (355) (95) (206)
Proceeds from sales of land, buildings and equipment 52 17 38
Cost of additions to internal use software (164) (98) (129)
Acquisitions, net of cash acquired (1,734) (163) (155)
Net change in escrow and other restricted investments 20 (6) 8
Other investing, net 3 2 3
Net cash used in investing activities (2,178) (343) (441)
Cash Flows from Financing Activities:
Net proceeds (payments) on secured financings 1 (57) (227)
Net (payments) proceeds on other debt (3,057) 923 926
Common stock dividends (215) (149) (154)
Preferred stock dividends (15) — —
Proceeds from issuances of common stock 183 1 6
Excess tax benefits from stock-based compensation 24 — 2
Payments to acquire treasury stock, including fees — — (812)
Repurchases related to stock-based compensation (15) (12) (33)
Other financing (22) (14) (19)
Net cash (used in) provided by financing activities (3,116) 692 (311)
Effect of exchange rate changes on cash and cash equivalents (20) 13 (57)
(Decrease) increase in cash and cash equivalents (2,588) 2,570 130
Cash and cash equivalents at beginning of year 3,799 1,229 1,099
Cash and Cash Equivalents at End of Year $ 1,211 $ 3,799 $ 1,229