Xerox 2010 Annual Report Download - page 74
Download and view the complete annual report
Please find page 74 of the 2010 Xerox annual report below. You can navigate through the pages in the report by either clicking on the pages listed below, or by using the keyword search tool below to find specific information within the annual report.-
 1
1 -
2
-
3
-
4
-
5
-
6
-
7
-
8
-
9
-
10
-
11
-
12
-
13
-
14
-
15
-
16
-
17
-
18
-
19
-
20
-
21
-
22
-
23
-
24
-
25
-
26
-
27
-
28
-
29
-
30
-
31
-
32
-
33
-
34
-
35
-
36
-
37
-
38
-
39
-
40
-
41
-
42
-
43
-
44
-
45
-
46
-
47
-
48
-
49
-
50
-
51
-
52
-
53
-
54
-
55
-
56
-
57
-
58
-
59
-
60
-
61
-
62
-
63
-
 64
64 -
 65
65 -
 66
66 -
 67
67 -
 68
68 -
 69
69 -
 70
70 -
 71
71 -
 72
72 -
 73
73 -
 74
74 -
 75
75 -
 76
76 -
 77
77 -
 78
78 -
 79
79 -
 80
80 -
 81
81 -
 82
82 -
 83
83 -
 84
84 -
85
-
86
-
87
-
88
-
89
-
90
-
91
-
92
-
93
-
94
-
95
-
96
-
97
-
98
-
99
-
100
-
101
-
102
-
103
-
104
-
105
-
106
-
107
-
108
-
109
-
110
-
111
-
112
 |
 |

Notes to the Consolidated
Financial Statements
Dollars in millions, except per-share data and unless otherwise indicated.
72 Xerox 2010 Annual Report
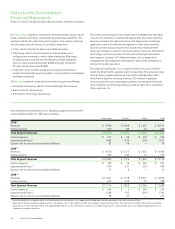
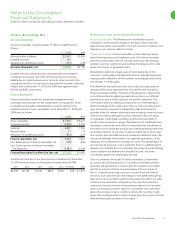
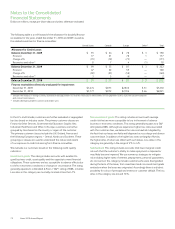
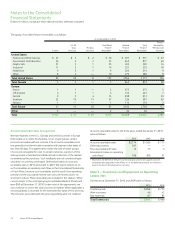
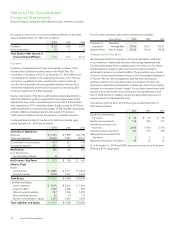
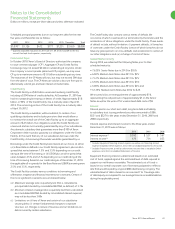
The following table is a roll-forward of the allowance for doubtful finance
receivables for the years ended December 31, 2010 and 2009, as well as
the related investment in finance receivables:
United States Canada Europe Other(2) Total
Allowance for Credit Losses:
Balance December 31, 2008 $ 93 $ 24 $ 78 $ 3 $ 198
Provision 77 21 78 1 177
Charge-offs (79) (19) (73) — (171)
Recoveries and other(1) 8 7 4 (1) 18
Balance December 31, 2009 $ 99 $ 33 $ 87 $ 3 $ 222
Provision 47 22 59 — 128
Charge-offs (58) (23) (59) — (140)
Recoveries and other(1) 3 5 (6) — 2
Balance December 31, 2010 $ 91 $ 37 $ 81 $ 3 $ 212
Finance receivables collectively evaluated for impairment:
December 31, 2009 $ 3,474 $ 873 $ 2,832 $ 51 $ 7,230
December 31, 2010 $ 3,177 $ 872 $ 2,706 $ 66 $ 6,821
(1) Includes the impacts of foreign currency translation and adjustments to reserves necessary to reflect events of non-payment such as customer accommodations
and contract terminations.
(2) Includes developing market countries and smaller units.
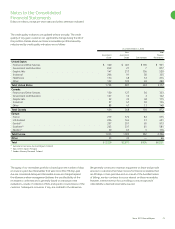
In the U.S. and Canada, customers are further evaluated or segregated
by class based on industry sector. The primary customer classes are
Finance & Other Services, Government & Education; Graphic Arts;
Industrial; Healthcare and Other. In Europe, customers are further
grouped by class based on the country or region of the customer.
The primary customer classes include the U.K./Ireland, France and
the following European regions – Central, Nordic and Southern. These
groupings or classes are used to understand the nature and extent
of our exposure to credit risk arising from finance receivables.
We evaluate our customers based on the following credit quality
indicators:
Investment grade: This rating includes accounts with excellent to
good business credit, asset quality and the capacity to meet financial
obligations. These customers are less susceptible to adverse effects due
to shifts in economic conditions or changes in circumstance. The rating
generally equates to a Standard & Poors (“S&P”) rating of BBB- or better.
Loss rates in this category are normally minimal at less than 1%.
Non-investment grade: This rating includes accounts with average
credit risk that are more susceptible to loss in the event of adverse
business or economic conditions. This rating generally equates to a S&P
rating below BBB-. Although we experience higher loss rates associated
with this customer class, we believe the risk is somewhat mitigated by
the fact that our leases are fairly well dispersed across a large and diverse
customer base. In addition, the higher loss rates are largely offset by
the higher rates of return we obtain with such leases. Loss rates in this
category are generally in the range of 2% to 4%.
Substandard: This rating includes accounts that have marginal credit
risk such that the customer’s ability to make repayment is impaired or
may likely become impaired. We use numerous strategies to mitigate
risk including higher rates of interest, prepayments, personal guarantees,
etc. Accounts in this category include customers who were downgraded,
during the term of the lease, from investment and non-investment grade
evaluation when the lease was originated. Accordingly there is a distinct
possibility for a loss of principal and interest or customer default. The loss
rates in this category are around 10%.