Xerox 2010 Annual Report Download - page 89
Download and view the complete annual report
Please find page 89 of the 2010 Xerox annual report below. You can navigate through the pages in the report by either clicking on the pages listed below, or by using the keyword search tool below to find specific information within the annual report.-
 1
1 -
2
-
3
-
4
-
5
-
6
-
7
-
8
-
9
-
10
-
11
-
12
-
13
-
14
-
15
-
16
-
17
-
18
-
19
-
20
-
21
-
22
-
23
-
24
-
25
-
26
-
27
-
28
-
29
-
30
-
31
-
32
-
33
-
34
-
35
-
36
-
37
-
38
-
39
-
40
-
41
-
42
-
43
-
44
-
45
-
46
-
47
-
48
-
49
-
50
-
51
-
52
-
53
-
54
-
55
-
56
-
57
-
58
-
59
-
60
-
61
-
62
-
63
-
64
-
65
-
66
-
67
-
68
-
69
-
70
-
71
-
72
-
73
-
74
-
75
-
76
-
77
-
78
-
 79
79 -
 80
80 -
 81
81 -
 82
82 -
 83
83 -
 84
84 -
 85
85 -
 86
86 -
 87
87 -
 88
88 -
 89
89 -
 90
90 -
 91
91 -
 92
92 -
 93
93 -
 94
94 -
 95
95 -
 96
96 -
 97
97 -
 98
98 -
 99
99 -
100
-
101
-
102
-
103
-
104
-
105
-
106
-
107
-
108
-
109
-
110
-
111
-
112
 |
 |

Notes to the Consolidated
Financial Statements
Dollars in millions, except per-share data and unless otherwise indicated.
87Xerox 2010 Annual Report
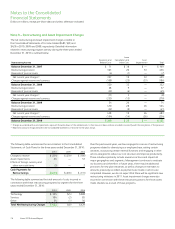
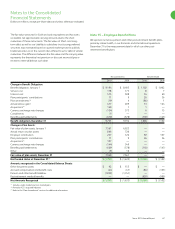
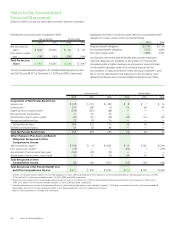
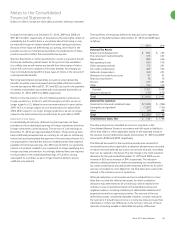
Note 15 – Employee Benefit Plans
We sponsor numerous pension and other post-retirement benefit plans,
primarily retiree health, in our domestic and international operations.
December 31 is the measurement date for all of our other post-
retirement benefit plans.
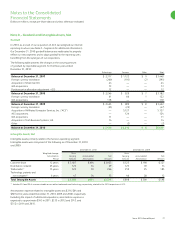
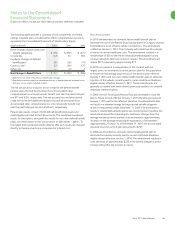
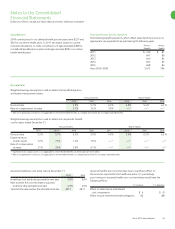
The fair value amounts for Cash and cash equivalents and Accounts
receivable, net approximate carrying amounts due to the short
maturities of these instruments. The fair value of Short- and Long-
term debt, as well as our Liability to subsidiary trust issuing preferred
securities, was estimated based on quoted market prices for publicly
traded securities or on the current rates offered to us for debt of similar
maturities. The difference between the fair value and the carrying value
represents the theoretical net premium or discount we would pay or
receive to retire all debt at such date.
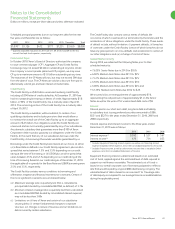
Pension Benefits Retiree Health
2010 2009 2010 2009
Change in Benefit Obligation:
Benefit obligation, January 1 $ 9,194 $ 8,495 $ 1,102 $ 1,002
Service cost 178 173 8 7
Interest cost 575 508 54 60
Plan participants’ contributions 11 9 26 36
Plan amendments(3) (19) 4 (86) 1
Actuarial loss (gain) 477 209 13 124
Acquisitions(2) 140 1 1 —
Currency exchange rate changes (154) 373 6 15
Curtailments (1) — — —
Benefits paid/settlements (670) (578) (118) (143)
Benefit obligation, December 31 9,731 9,194 1,006 1,102
Change in Plan Assets:
Fair value of plan assets, January 1 7,561 6,923 — —
Actual return on plan assets 846 720 — —
Employer contribution 237 122 92 107
Plan participants’ contributions 11 9 26 36
Acquisitions(3) 107 — — —
Currency exchange rate changes (144) 349 — —
Benefits paid/settlements (669) (578) (118) (143)
Other (9) 16 — —
Fair value of plan assets, December 31 7,940 7,561 — —
Net funded status at December 31(1) $ (1,791) $ (1,633) $ (1,006) $ (1,102)
Amounts recognized in the Consolidated Balance Sheets:
Other long-term assets $ 92 $ 155 $ — $ —
Accrued compensation and benefit costs (44) (47) (86) (103)
Pension and other benefit liabilities (1,839) (1,741) — —
Post-retirement medical benefits — — (920) (999)
Net Amounts Recognized $ (1,791) $ (1,633) $ (1,006) $ (1,102)
(1) Includes under-funded and non-funded plans.
(2) Primarily ACS’s acquired balances.
(3) Refer to the “Plan Amendment” section for additional information.