Xerox 2010 Annual Report Download - page 38
Download and view the complete annual report
Please find page 38 of the 2010 Xerox annual report below. You can navigate through the pages in the report by either clicking on the pages listed below, or by using the keyword search tool below to find specific information within the annual report.-
 1
1 -
2
-
3
-
4
-
5
-
6
-
7
-
8
-
9
-
10
-
11
-
12
-
13
-
14
-
15
-
16
-
17
-
18
-
19
-
20
-
21
-
22
-
23
-
24
-
25
-
26
-
27
-
 28
28 -
 29
29 -
 30
30 -
 31
31 -
 32
32 -
 33
33 -
 34
34 -
 35
35 -
 36
36 -
 37
37 -
 38
38 -
 39
39 -
 40
40 -
 41
41 -
 42
42 -
 43
43 -
 44
44 -
 45
45 -
 46
46 -
 47
47 -
 48
48 -
49
-
50
-
51
-
52
-
53
-
54
-
55
-
56
-
57
-
58
-
59
-
60
-
61
-
62
-
63
-
64
-
65
-
66
-
67
-
68
-
69
-
70
-
71
-
72
-
73
-
74
-
75
-
76
-
77
-
78
-
79
-
80
-
81
-
82
-
83
-
84
-
85
-
86
-
87
-
88
-
89
-
90
-
91
-
92
-
93
-
94
-
95
-
96
-
97
-
98
-
99
-
100
-
101
-
102
-
103
-
104
-
105
-
106
-
107
-
108
-
109
-
110
-
111
-
112
 |
 |

36
Management’s Discussion
Xerox 2010 Annual Report
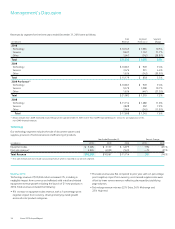
Revenue2009
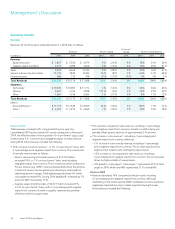
Services revenue of $3,476 million decreased 9% including a
2-percentage point negative impact from currency. Services revenue
for 2009 and 2008 primarily reflects revenue from DO services.
The decrease in revenue is primarily due to lower usage, primarily
in black-and-white devices.
SegmentProt2009
Services operating profit of $231 million decreased $71 million from
2008. The decrease was primarily due to lower gross profit reflecting
a decrease in revenues partially offset by lower cost and expenses
reflecting benefits from restructuring and favorable currency.
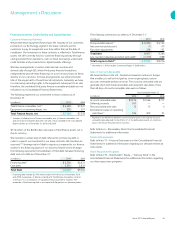
Other
Revenue2010
Other revenue of $1,647 million increased 1%, including a negligible
impact from currency. Increases in GIS’s network integration and
electronic presentation systems and Wide Format sales offset a decline
in paper sales. Paper comprised approximately 58% of the Other
segment revenue.
SegmentLoss2010
Other segment loss of $342 million was flat with 2009, as higher gross
profit reflecting an increase in gross margins from the mix of revenues
was partially offset by higher interest expense associated with funding
for the ACS acquisition.
Revenue2009
Other revenue of $1,636 million decreased 21%, including a
2-percentage point negative impact from currency, primarily driven by
declines in revenue from paper, wide format systems, and licensing and
royalty arrangements. Paper comprised approximately, 60% of the
Other segment revenue.
SegmentLoss2009
Other operating loss of $342 million increased $97 million from
2008, primarily due to lower revenue, as well as lower interest and
equity income.
(1) Refer to the “Non-GAAP Financial Measures” section for an explanation of the
Pro-forma non-GAAP financial measure.
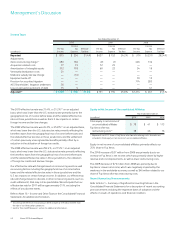
SegmentProt2010
Services operating profit of $1,132 million increased $901 million or
$124 million on a pro-forma(1) basis from 2009, driven primarily by BPO
growth and lower G&A expenses.
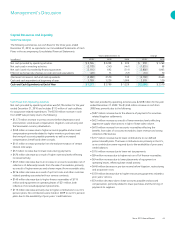
Metrics
Pipeline
Our BPO and ITO revenue pipeline including synergy opportunities
grew 25% over the fourth quarter 2009. The sales pipeline includes
the Total Contract Value (“TCV”) of new business opportunities that
could potentially be contracted within the next six months and excludes
business opportunities with estimated annual recurring revenue in excess
of $100 million. The DO sales pipeline grew approximately 17% over the
fourth quarter 2009. The DO sales pipeline includes all active deals with
$10 million or greater in TCV.
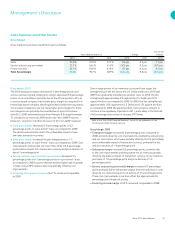
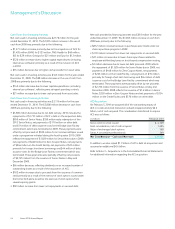
Signings
Signings (“Signings”) are defined as estimated future revenues from
contracts signed during the period, including renewals of existing
contracts. Services signings were an estimated $14.6 billion in TCV in
2010 and increased 13% as compared to the comparable prior-year
period. TCV represents estimated total revenue for future contracts for
pipeline or signed contracts for signings as applicable.
Signings were as follows:
(in billions) Year Ended December 31, 2010
BPO $ 10.0
DO 3.3
ITO 1.3
Total Signings $ 14.6
Signings growth was driven by strong signings in both our BPO and
DO businesses. In 2010 we signed significant new business in the
following areas:
Child support payment processing
•
Commercial healthcare
•
Customer care
•
Electronic payment cards
•
Enterprise print services
•
Government healthcare
•
Telecom and hardware services
•
Transportation
•