Xerox 2010 Annual Report Download - page 47
Download and view the complete annual report
Please find page 47 of the 2010 Xerox annual report below. You can navigate through the pages in the report by either clicking on the pages listed below, or by using the keyword search tool below to find specific information within the annual report.-
 1
1 -
2
-
3
-
4
-
5
-
6
-
7
-
8
-
9
-
10
-
11
-
12
-
13
-
14
-
15
-
16
-
17
-
18
-
19
-
20
-
21
-
22
-
23
-
24
-
25
-
26
-
27
-
28
-
29
-
30
-
31
-
32
-
33
-
34
-
35
-
36
-
 37
37 -
 38
38 -
 39
39 -
 40
40 -
 41
41 -
 42
42 -
 43
43 -
 44
44 -
 45
45 -
 46
46 -
 47
47 -
 48
48 -
 49
49 -
 50
50 -
 51
51 -
 52
52 -
 53
53 -
 54
54 -
 55
55 -
 56
56 -
 57
57 -
58
-
59
-
60
-
61
-
62
-
63
-
64
-
65
-
66
-
67
-
68
-
69
-
70
-
71
-
72
-
73
-
74
-
75
-
76
-
77
-
78
-
79
-
80
-
81
-
82
-
83
-
84
-
85
-
86
-
87
-
88
-
89
-
90
-
91
-
92
-
93
-
94
-
95
-
96
-
97
-
98
-
99
-
100
-
101
-
102
-
103
-
104
-
105
-
106
-
107
-
108
-
109
-
110
-
111
-
112
 |
 |
45Xerox 2010 Annual Report
Management’s Discussion
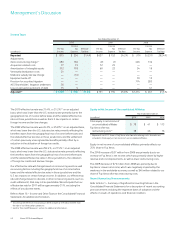
The following summarizes our debt as of December 31:
(in millions) 2010 2009
Principal debt balance(1) $ 8,380 $ 9,122
Net unamortized discount (1) (11)
Fair value adjustments 228 153
Total Debt 8,607 9,264
Less: Current maturities and short-term debt(1) (1,370) (988)
Total Long-term Debt(1) $ 7,237 $ 8,276
(1) December 31, 2010 includes Commercial Paper of $300 million.
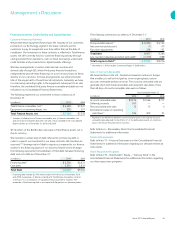
SalesofAccountsReceivable
We have facilities in the U.S., Canada and several countries in Europe
that enable us to sell to third parties, on an ongoing basis, certain
accounts receivable without recourse. The accounts receivable sold are
generally short-term trade receivables with payment due dates of less
than 60 days. Accounts receivable sales were as follows:
Year Ended December 31,
(in millions) 2010 2009 2008
Accounts receivable sales $ 2,374 $ 1,566 $ 717
Deferred proceeds 307 — —
Fees associated with sales 15 13 4
Estimated increase on operating
cash flows(1) 106 309 51
(1)
Represents the difference between current and prior-year fourth-quarter accounts
receivable sales adjusted for the effects of: (i) the deferred proceeds, (ii) collections
prior to the end of the year and (iii) currency.
Refer to Note 4 – Receivables, Net in the Consolidated Financial
Statements for additional information.
FinancialInstruments
Refer to Note 13 – Financial Instruments in the Consolidated Financial
Statements for additional information regarding our derivative financial
instruments.
ShareRepurchasePrograms
Refer to Note 19 – Shareholders’ Equity – “Treasury Stock” in the
Consolidated Financial Statements for additional information regarding
our share repurchase programs.
Financing Activities, Credit Facility and Capital Markets
CustomerFinancingActivities
We provide lease equipment financing to the majority of our customers,
primarily in our Technology segment. Our lease contracts permit
customers to pay for equipment over time rather than at the date of
installation. Our investment in these contracts is reflected in Total finance
assets, net. We currently fund our customer financing activity through
cash generated from operations, cash on hand, borrowings under bank
credit facilities and proceeds from capital markets offerings.
We have arrangements in certain international countries and
domestically through GIS, where third-party financial institutions
independently provide lease financing, on a non-recourse basis to Xerox,
directly to our customers. In these arrangements, we sell and transfer
title of the equipment to these financial institutions. Generally, we have
no continuing ownership rights in the equipment subsequent to its sale;
therefore, the unrelated third-party finance receivable and debt are not
included in our Consolidated Financial Statements.
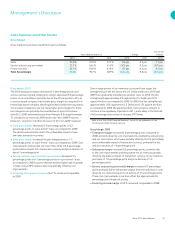
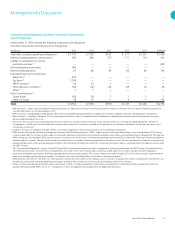
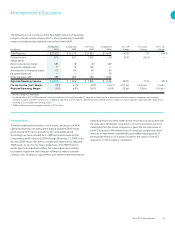
The following represents our investment in lease contracts as of
December 31:
(in millions) 2010 2009
Total Finance receivables, net (1) $ 6,620 $ 7,027
Equipment on operating leases, net 530 551
Total Finance Assets, net $ 7,150 $ 7,578
(1) Includes (i) billed portion of finance receivables, net, (ii) finance receivables, net
and (iii) finance receivables due after one year, net as included in the Consolidated
Balance Sheets as of December 31, 2010 and 2009.
$134 million of the $428 million decrease in Total finance assets, net is
due to currency.
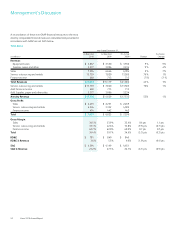
We maintain a certain level of debt, referred to as financing debt, in
order to support our investment in our lease contracts. We maintain an
assumed 7:1 leverage ratio of debt to equity as compared to our finance
assets for this financing aspect of our business. Based on this leverage,
the following represents the breakdown of Total debt between financing
debt and core debt as of December 31:
(in millions) 2010 2009
Financing debt(1) $ 6,256 $ 6,631
Core debt 2,351 2,633
Total Debt $ 8,607 $ 9,264
(1) Financing debt includes $5,793 million and $6,149 million as of December 2010
and 2009, respectively, of debt associated with Total finance receivables, net and
is the basis for our calculation of “equipment financing interest” expense. The
remainder of the financing debt is associated with Equipment on operating leases.