Xerox 2010 Annual Report Download - page 26
Download and view the complete annual report
Please find page 26 of the 2010 Xerox annual report below. You can navigate through the pages in the report by either clicking on the pages listed below, or by using the keyword search tool below to find specific information within the annual report.-
 1
1 -
2
-
3
-
4
-
5
-
6
-
7
-
8
-
9
-
10
-
11
-
12
-
13
-
14
-
15
-
 16
16 -
 17
17 -
 18
18 -
 19
19 -
 20
20 -
 21
21 -
 22
22 -
 23
23 -
 24
24 -
 25
25 -
 26
26 -
 27
27 -
 28
28 -
 29
29 -
 30
30 -
 31
31 -
 32
32 -
 33
33 -
 34
34 -
 35
35 -
 36
36 -
37
-
38
-
39
-
40
-
41
-
42
-
43
-
44
-
45
-
46
-
47
-
48
-
49
-
50
-
51
-
52
-
53
-
54
-
55
-
56
-
57
-
58
-
59
-
60
-
61
-
62
-
63
-
64
-
65
-
66
-
67
-
68
-
69
-
70
-
71
-
72
-
73
-
74
-
75
-
76
-
77
-
78
-
79
-
80
-
81
-
82
-
83
-
84
-
85
-
86
-
87
-
88
-
89
-
90
-
91
-
92
-
93
-
94
-
95
-
96
-
97
-
98
-
99
-
100
-
101
-
102
-
103
-
104
-
105
-
106
-
107
-
108
-
109
-
110
-
111
-
112
 |
 |
24
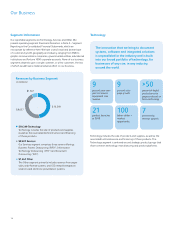
Manufacturing and Supply
Our manufacturing and distribution facilities are located around the
world. The company’s largest manufacturing site is in Webster, New
York,whereweproducefusers,photoreceptors,XeroxiGenandNuvera®
systems, components, consumables and other products, and we have
an EA Toner plant located in Webster. Our other primary manufacturing
operations are located in: Dundalk, Ireland, for our high-end production
products and consumables; and Wilsonville, Oregon, for solid ink
products, consumable supplies and components for our Mid-range and
Entry products. We also have a major facility in Venray, Netherlands,
which handles supplies manufacturing and supply chain management
for the Eastern Hemisphere.
Our master supply agreement with Flextronics, a global electronics
manufacturing services company, to outsource portions of manufacturing
for our Mid-range and Entry businesses, continues into 2011.
We also acquire products from various third parties in order to increase the
breadth of our product portfolio and meet channel requirements. We have
arrangements with Fuji Xerox under which we purchase and sell products,
some of which are the result of mutual research and development
agreements.RefertoNote7–InvestmentsinAfliates,atEquityin
the Consolidated Financial Statements in our 2010 Annual Report for
additional information regarding our relationship with Fuji Xerox.
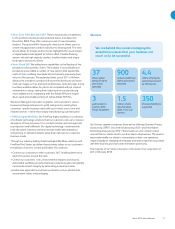
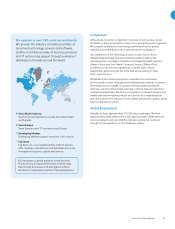
Services Global Production Model
We believe our global services production model is one of our key
competitive advantages. This model encompasses employees in
production centers around the world including India, Mexico, the
Philippines,Jamaica,Ghana,Brazil,Guatemala,Chile,Argentina,Spain,
Poland and Ireland, among others. Our global production model is
enabled by the use of proprietary technology, which allows us to securely
distribute client transactions within data privacy limits across a global
workforce. This global production model allows us to leverage lower-cost
production locations, consistent methodology and processes, and time
zone advantages.
Our Business
Customer Financing
Wenancealargeportionofourdirectchannelcustomerpurchases
of Xerox equipment through bundled lease agreements. We believe
thatnancingfacilitatescustomeracquisitionofXeroxtechnologyand
enhances our value proposition, while providing Xerox an attractive gross
margin and a reasonable return on our investment in this business.
Because our lease contracts permit customers to pay for equipment
over time rather than at the date of installation, we maintain a certain
level of debt to support our investment in these lease contracts. We
fundourcustomernancingactivitythroughacombinationofcash
generated from operations, cash on hand and proceeds from capital
marketofferings.AtDecember31,2010,wehad$6.6billionofnance
receivables and $0.6 billion of equipment on operating leases, or Total
Finance assets of $7.2 billion. We maintain an assumed 7:1 leverage
ratio of debt to equity as compared to our Finance assets and, therefore,
asignicantportionofour$8.6billionofdebtisassociatedwithour
nancingbusiness.