Xerox 2010 Annual Report Download - page 76
Download and view the complete annual report
Please find page 76 of the 2010 Xerox annual report below. You can navigate through the pages in the report by either clicking on the pages listed below, or by using the keyword search tool below to find specific information within the annual report.-
 1
1 -
2
-
3
-
4
-
5
-
6
-
7
-
8
-
9
-
10
-
11
-
12
-
13
-
14
-
15
-
16
-
17
-
18
-
19
-
20
-
21
-
22
-
23
-
24
-
25
-
26
-
27
-
28
-
29
-
30
-
31
-
32
-
33
-
34
-
35
-
36
-
37
-
38
-
39
-
40
-
41
-
42
-
43
-
44
-
45
-
46
-
47
-
48
-
49
-
50
-
51
-
52
-
53
-
54
-
55
-
56
-
57
-
58
-
59
-
60
-
61
-
62
-
63
-
64
-
65
-
 66
66 -
 67
67 -
 68
68 -
 69
69 -
 70
70 -
 71
71 -
 72
72 -
 73
73 -
 74
74 -
 75
75 -
 76
76 -
 77
77 -
 78
78 -
 79
79 -
 80
80 -
 81
81 -
 82
82 -
 83
83 -
 84
84 -
 85
85 -
 86
86 -
87
-
88
-
89
-
90
-
91
-
92
-
93
-
94
-
95
-
96
-
97
-
98
-
99
-
100
-
101
-
102
-
103
-
104
-
105
-
106
-
107
-
108
-
109
-
110
-
111
-
112
 |
 |
Notes to the Consolidated
Financial Statements
Dollars in millions, except per-share data and unless otherwise indicated.
74 Xerox 2010 Annual Report
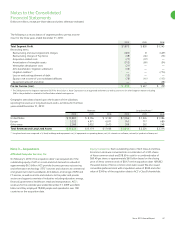
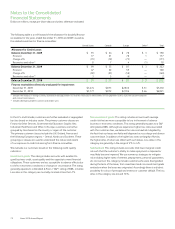
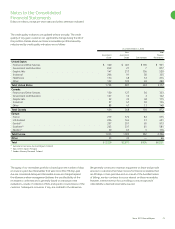
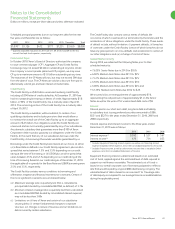
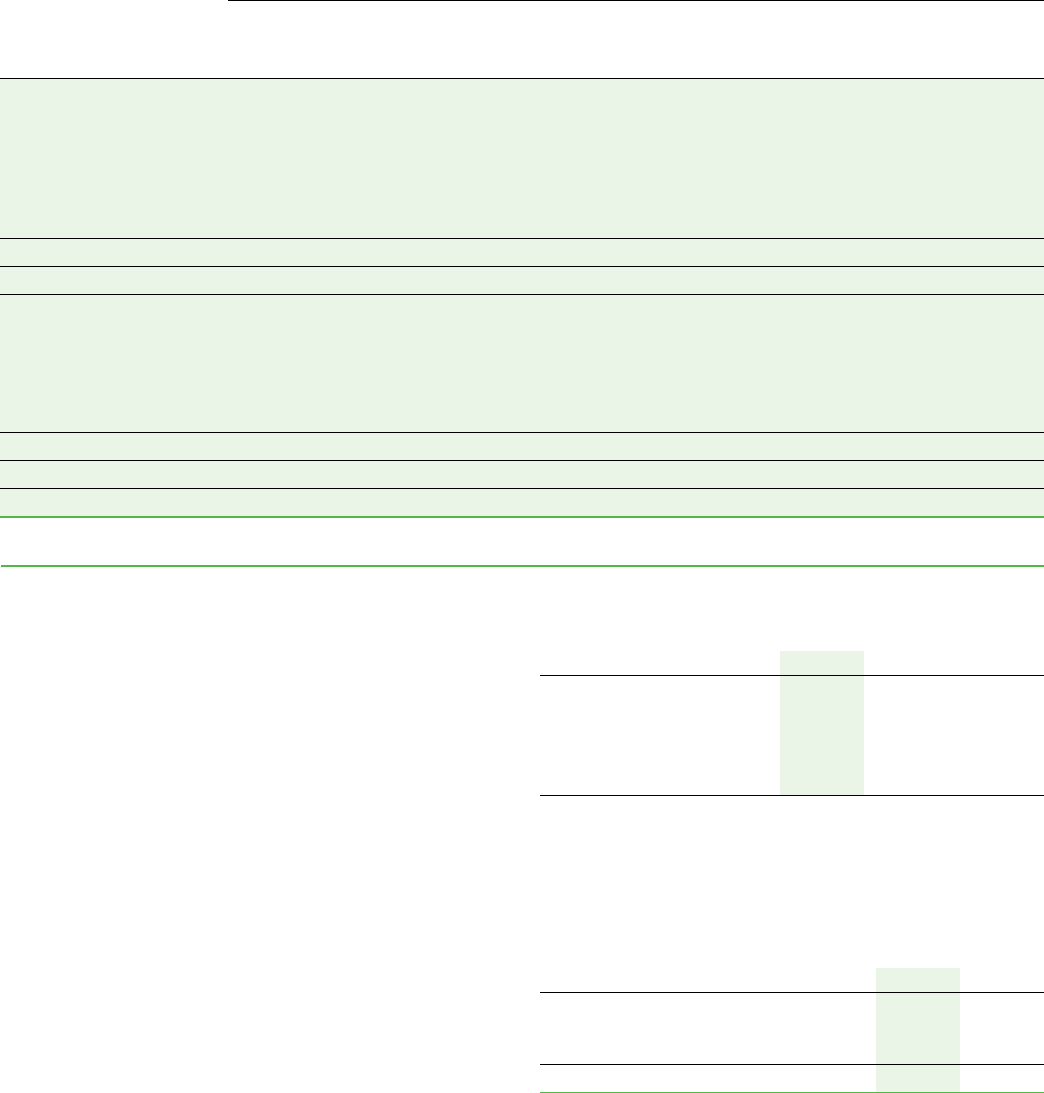
The aging of our billed finance receivables is as follows:
As of December 31, 2010
Finance
31–90 Total Billed Unbilled Total Receivables
Days >90 days Finance Finance Finance >90 Days and
Current Past Due Past Due Receivables Receivables Receivables Accruing
United States:
Finance and Other Services $ 23 $ 5 $ 2 $ 30 $ 921 $ 951 $ 23
Government and Education 26 6 3 35 842 877 40
Graphic Arts 21 3 1 25 495 520 16
Industrial 11 2 1 14 321 335 10
Healthcare 6 2 1 9 205 214 9
Other 8 2 — 10 270 280 8
Total United States 95 20 8 123 3,054 3,177 106
Total Canada 3 3 1 7 865 872 28
Europe:
France 1 1 — 2 673 675 5
U.K./Ireland 4 1 1 6 415 421 7
Central 9 2 4 15 898 913 39
Southern 32 10 15 57 524 581 99
Nordics 1 — — 1 115 116 2
Total Europe 47 14 20 81 2,625 2,706 152
Other 2 — — 2 64 66 —
Total $ 147 $ 37 $ 29 $ 213 $ 6,608 $ 6,821 $ 286
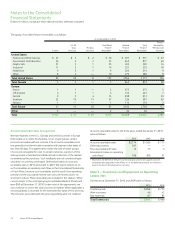
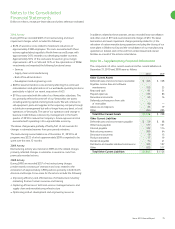
Accounts Receivable Sales Arrangements
We have facilities in the U.S., Canada and several countries in Europe
that enable us to sell to third parties, on an ongoing basis, certain
accounts receivable without recourse. The accounts receivables sold
are generally short-term trade receivables with payment due dates of
less than 60 days. The agreements involve the sale of entire groups
of accounts receivable for cash. In certain instances, a portion of the
sales proceeds is held back and deferred until collection of the related
receivables by the purchaser. Such holdbacks are not considered legal
securities nor are they certificated. Deferred proceeds on accounts
receivable sales in 2010 amounted to $307. We report collections on
such receivables as operating cash flows in the Consolidated Statements
of Cash Flows, because such receivables are the result of an operating
activity and the associated interest rate risk is de minimis due to its
short-term nature. These receivables are included in the caption “Other
current assets” in the accompanying Consolidated Balance Sheets and
were $90 at December 31, 2010. Under most of the agreements, we
also continue to service the sold accounts receivable. When applicable, a
servicing liability is recorded for the estimated fair value of the servicing.
The amounts associated with the servicing liability were not material.
Accounts receivable sales for the three years ended December 31, 2010
were as follows:
2010 2009 2008
Accounts receivable sales $ 2,374 $ 1,566 $ 717
Deferred proceeds 307 — —
Fees associated with sales 15 13 4
Estimated increase on operating
cash flows(1) 106 309 51
(1) Represents the difference between current and prior-year fourth-quarter accounts
receivable sales adjusted for the effects of: (i) the deferred proceeds, (ii) collections
prior to the end of the year and (iii) currency.
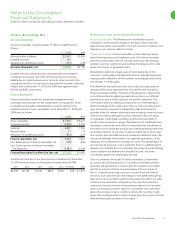
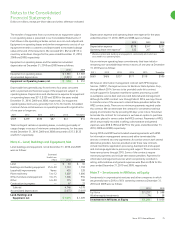
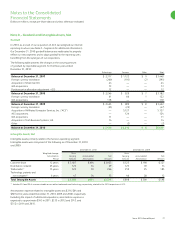
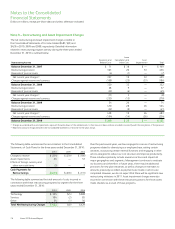
Note 5 – Inventories and Equipment on Operating
Leases, Net
Inventories at December 31, 2010 and 2009 were as follows:
2010 2009
Finished goods $ 858 $ 772
Work-in-process 46 43
Raw materials 87 85
Total Inventories $ 991 $ 900