Xerox 2010 Annual Report Download - page 54
Download and view the complete annual report
Please find page 54 of the 2010 Xerox annual report below. You can navigate through the pages in the report by either clicking on the pages listed below, or by using the keyword search tool below to find specific information within the annual report.-
 1
1 -
2
-
3
-
4
-
5
-
6
-
7
-
8
-
9
-
10
-
11
-
12
-
13
-
14
-
15
-
16
-
17
-
18
-
19
-
20
-
21
-
22
-
23
-
24
-
25
-
26
-
27
-
28
-
29
-
30
-
31
-
32
-
33
-
34
-
35
-
36
-
37
-
38
-
39
-
40
-
41
-
42
-
43
-
 44
44 -
 45
45 -
 46
46 -
 47
47 -
 48
48 -
 49
49 -
 50
50 -
 51
51 -
 52
52 -
 53
53 -
 54
54 -
 55
55 -
 56
56 -
 57
57 -
 58
58 -
 59
59 -
 60
60 -
 61
61 -
 62
62 -
 63
63 -
 64
64 -
65
-
66
-
67
-
68
-
69
-
70
-
71
-
72
-
73
-
74
-
75
-
76
-
77
-
78
-
79
-
80
-
81
-
82
-
83
-
84
-
85
-
86
-
87
-
88
-
89
-
90
-
91
-
92
-
93
-
94
-
95
-
96
-
97
-
98
-
99
-
100
-
101
-
102
-
103
-
104
-
105
-
106
-
107
-
108
-
109
-
110
-
111
-
112
 |
 |
52
Management’s Discussion
Xerox 2010 Annual Report
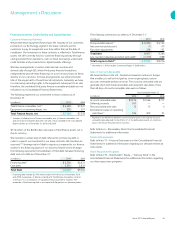
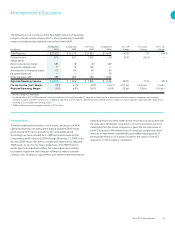
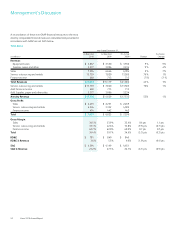
A reconciliation of these non-GAAP financial measures to the most
directly comparable financial measures calculated and presented in
accordance with GAAP are set forth below.
Total Xerox
Year Ended December 31,
As Reported As Reported Pro-forma Pro-forma
(in millions) 2010 2009 2009(1) Change Change
Revenue:
Equipment sales $ 3,857 $ 3,550 $ 3,550 9% 9%
Supplies, paper and other 3,377 3,096 3,234 9% 4%
Sales 7,234 6,646 6,784 9% 7%
Service, outsourcing and rentals 13,739 7,820 13,585 76% 1%
Finance income 660 713 713 (7)% (7)%
Total Revenues $ 21,633 $ 15,179 $ 21,082 43% 3%
Service, outsourcing and rentals $ 13,739 $ 7,820 $ 13,585 76% 1%
Add: Finance income 660 713 713
Add: Supplies, paper and other sales 3,377 3,096 3,234
Annuity Revenue $ 17,776 $ 11,629 $ 17,532 53% 1%
Gross Profit:
Sales $ 2,493 $ 2,251 $ 2,269
Service, outsourcing and rentals 4,544 3,332 4,585
Finance income 414 442 442
Total $ 7,451 $ 6,025 $ 7,296
Gross Margin:
Sales 34.5% 33.9% 33.4% 0.6 pts 1.1 pts
Service, outsourcing and rentals 33.1% 42.6% 33.8% (9.5) pts (0.7) pts
Finance income 62.7% 62.0% 62.0% 0.7 pts 0.7 pts
Total 34.4% 39.7% 34.6% (5.3) pts (0.2) pts
RD&E $ 781 $ 840 $ 840
RD&E % Revenue 3.6% 5.5% 4.0% (1.9) pts (0.4) pts
SAG $ 4,594 $ 4,149 $ 4,651
SAG % Revenue 21.2% 27.3% 22.1% (6.1) pts (0.9) pts