Xerox 2010 Annual Report Download - page 51
Download and view the complete annual report
Please find page 51 of the 2010 Xerox annual report below. You can navigate through the pages in the report by either clicking on the pages listed below, or by using the keyword search tool below to find specific information within the annual report.-
 1
1 -
2
-
3
-
4
-
5
-
6
-
7
-
8
-
9
-
10
-
11
-
12
-
13
-
14
-
15
-
16
-
17
-
18
-
19
-
20
-
21
-
22
-
23
-
24
-
25
-
26
-
27
-
28
-
29
-
30
-
31
-
32
-
33
-
34
-
35
-
36
-
37
-
38
-
39
-
40
-
 41
41 -
 42
42 -
 43
43 -
 44
44 -
 45
45 -
 46
46 -
 47
47 -
 48
48 -
 49
49 -
 50
50 -
 51
51 -
 52
52 -
 53
53 -
 54
54 -
 55
55 -
 56
56 -
 57
57 -
 58
58 -
 59
59 -
 60
60 -
 61
61 -
62
-
63
-
64
-
65
-
66
-
67
-
68
-
69
-
70
-
71
-
72
-
73
-
74
-
75
-
76
-
77
-
78
-
79
-
80
-
81
-
82
-
83
-
84
-
85
-
86
-
87
-
88
-
89
-
90
-
91
-
92
-
93
-
94
-
95
-
96
-
97
-
98
-
99
-
100
-
101
-
102
-
103
-
104
-
105
-
106
-
107
-
108
-
109
-
110
-
111
-
112
 |
 |

49Xerox 2010 Annual Report
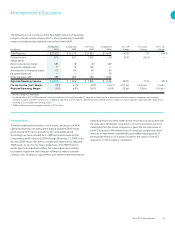
Management’s Discussion
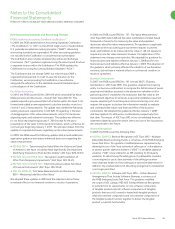
Foreign Exchange Risk Management
Assuming a 10% appreciation or depreciation in foreign currency
exchange rates from the quoted foreign currency exchange rates at
December 31, 2010, the potential change in the fair value of foreign
currency-denominated assets and liabilities in each entity would
not be significant because all material currency asset and liability
exposures were economically hedged as of December 31, 2010. A 10%
appreciation or depreciation of the U.S. Dollar against all currencies
from the quoted foreign currency exchange rates at December 31,
2010 would have a $528 million impact on our cumulative translation
adjustment portion of equity. The net amount invested in foreign
subsidiaries and affiliates, primarily Xerox Limited, Fuji Xerox, Xerox
Canada Inc. and Xerox do Brasil, and translated into U.S. Dollars using
the year-end exchange rates, was $5.3 billion at December 31, 2010.
Interest Rate Risk Management
The consolidated weighted-average interest rates related to our total
debt and liability to subsidiary trust issuing preferred securities for 2010,
2009 and 2008 approximated 5.8%, 6.1% and 6.6%, respectively.
Interest expense includes the impact of our interest rate derivatives.
Virtually all customer-financing assets earn fixed rates of interest.
The interest rates on a significant portion of the Company’s term debt
are fixed.
As of December 31, 2010, $952 million of our total debt carried variable
interest rates, including the effect of pay variable interest rate swaps we
use to reduce the effective interest rate on our fixed coupon debt.
The fair market values of our fixed-rate financial instruments are sensitive
to changes in interest rates. At December 31, 2010, a 10% change
in market interest rates would change the fair values of such financial
instruments by approximately $194 million.
UnrecognizedTaxBenets
As of December 31, 2010, we had $186 million of unrecognized tax
benefits. This represents the tax benefits associated with various tax
positions taken, or expected to be taken, on domestic and international
tax returns that have not been recognized in our financial statements
due to uncertainty regarding their resolution. The resolution or
settlement of these tax positions with the taxing authorities is at
various stages and therefore we are unable to make a reliable estimate
of the eventual cash flows by period that may be required to settle
these matters. In addition, certain of these matters may not require
cash settlement due to the existence of credit and net operating loss
carryforwards, as well as other offsets, including the indirect benefit
from other taxing jurisdictions that may be available.
Off-Balance Sheet Arrangements
Although we rarely utilize off-balance sheet arrangements in our
operations, we enter into operating leases in the normal course of
business. The nature of these lease arrangements is discussed in Note
6 – Land, Buildings and Equipment, Net in the Consolidated Financial
Statements. In addition, we have facilities in the U.S., Canada and
several countries in Europe that enable us to sell to third parties, on an
ongoing basis, certain accounts receivable without recourse. Refer to
Note 4 – Receivables, Net in the Consolidated Financial Statements for
further additional information.
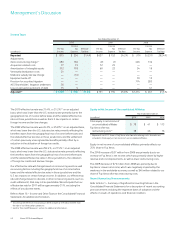
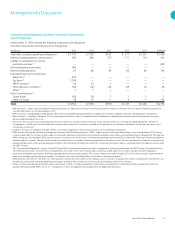
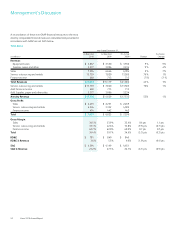
See the table above for the Company’s contractual cash obligations and
other commercial commitments and Note 17 – Contingencies in the
Consolidated Financial Statements for additional information regarding
our guarantees, indemnifications and warranty liabilities.
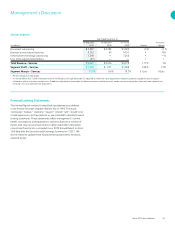
Financial Risk Management
We are exposed to market risk from foreign currency exchange rates
and interest rates, which could affect operating results, financial position
and cash flows. We manage our exposure to these market risks through
our regular operating and financing activities and, when appropriate,
through the use of derivative financial instruments. We utilized derivative
financial instruments to hedge economic exposures, as well as reduce
earnings and cash flow volatility resulting from shifts in market rates.
Recent market events have not caused us to materially modify or change
our financial risk management strategies with respect to our exposures
to interest rate and foreign currency risk. Refer to Note 13 – Financial
Instruments in the Consolidated Financial Statements for additional
discussion on our financial risk management.