Xerox 2010 Annual Report Download - page 41
Download and view the complete annual report
Please find page 41 of the 2010 Xerox annual report below. You can navigate through the pages in the report by either clicking on the pages listed below, or by using the keyword search tool below to find specific information within the annual report.-
 1
1 -
2
-
3
-
4
-
5
-
6
-
7
-
8
-
9
-
10
-
11
-
12
-
13
-
14
-
15
-
16
-
17
-
18
-
19
-
20
-
21
-
22
-
23
-
24
-
25
-
26
-
27
-
28
-
29
-
30
-
 31
31 -
 32
32 -
 33
33 -
 34
34 -
 35
35 -
 36
36 -
 37
37 -
 38
38 -
 39
39 -
 40
40 -
 41
41 -
 42
42 -
 43
43 -
 44
44 -
 45
45 -
 46
46 -
 47
47 -
 48
48 -
 49
49 -
 50
50 -
 51
51 -
52
-
53
-
54
-
55
-
56
-
57
-
58
-
59
-
60
-
61
-
62
-
63
-
64
-
65
-
66
-
67
-
68
-
69
-
70
-
71
-
72
-
73
-
74
-
75
-
76
-
77
-
78
-
79
-
80
-
81
-
82
-
83
-
84
-
85
-
86
-
87
-
88
-
89
-
90
-
91
-
92
-
93
-
94
-
95
-
96
-
97
-
98
-
99
-
100
-
101
-
102
-
103
-
104
-
105
-
106
-
107
-
108
-
109
-
110
-
111
-
112
 |
 |

39Xerox 2010 Annual Report
Management’s Discussion
$177 million decrease in general and administrative expenses,
•
reflecting favorable currency and benefits from restructuring and
cost actions, partially offset by higher compensation accruals
$103 million increase in bad debt expense, reflecting increased
•
write-offs in North America and Europe
SAG2009
SAG of $4,149 million was $385 million lower than 2008, including
a $126 million benefit from currency. The SAG decrease was the result
of the following:
$311 million decrease in selling expenses, reflecting favorable currency;
•
benefits from restructuring, an overall reduction in marketing spend
and lower commissions
As previously noted, the acquisition of ACS increased the proportion
of revenues from Services. Consistent with services companies, this
portion of our operations has a lower gross margin than our Technology
segment, but also has both lower SAG and R&D as a percent of revenue.
Accordingly, in 2010 we began to assess our performance using
an operating margin metric, which neutralizes this mix differential.
Operating margin is an internal measurement metric and represents
gross margin minus RD&E percentage of revenue and SAG percentage
of revenue. (Refer to the “Non-GAAP Financial Measures” section for
further information and the reconciliation of operating margin to pre-tax
income (loss) margin.)
During 2010, operating margin increased 2.8-percentage points or
1.0-percentage-point on a pro-forma(1) basis, as compared to 2009.
The improvement reflects strong revenue growth and continued
disciplined cost and expense management. During 2009, operating
margin decreased 1.6-percentage points largely due to lower revenue
as a result of the worldwide recession, as well as the negative effects
of currency on our product costs, which were only partially offset by
savings from prior-year restructuring actions.
Restructuring and Asset Impairment Charges
2010Activity
During 2010 we recorded $483 million of net restructuring and asset
impairment charges which included the following:
$470 million of severance costs related to headcount reductions of
•
approximately 9,000 employees. The costs associated with these
actions applied about equally to North America and Europe, with
approximately 20% related to our developing market countries.
Approximately 50% of the costs were focused on gross margin
improvements, 40% on SAG and 10% on the optimization of RD&E
investments, and impacted the following functional areas:
– Services
– Supply chain and manufacturing
– Back-office administration
– Development and engineering
$28 million for lease termination costs, primarily reflecting the
•
continued rationalization and optimization of our worldwide operating
locations, including consolidations with ACS.
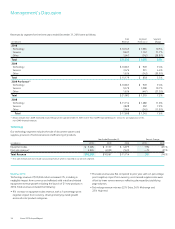
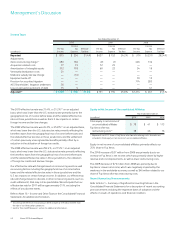
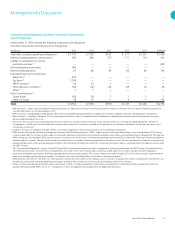
Summary Costs and Expenses
The following is a summary of key metrics used to assess our performance:
Pro-forma(1)
Year Ended December 31, Change Change
(in millions) 2010 2009 2008 2010 2009 2010
Total Gross Margin 34.4% 39.7% 38.9% (5.3) pts 0.8 pts (0.2) pts
RD&E % of revenue 3.6% 5.5% 5.0% (1.9) pts 0.5 pts (0.4) pts
SAG % of revenue 21.2% 27.3% 25.7% (6.1) pts 1.6 pts (0.9) pts
Operating Margin(1) 9.6% 6.8% 8.4% 2.8 pts (1.6) pts 1.0 pts
Pre-tax income (loss) margin 3.8% 4.1% (0.4)% (0.3) pts 4.5 pts (2.2) pts
(1) See the “Non-GAAP Measures” section for additional information.