Xerox 2010 Annual Report Download - page 36
Download and view the complete annual report
Please find page 36 of the 2010 Xerox annual report below. You can navigate through the pages in the report by either clicking on the pages listed below, or by using the keyword search tool below to find specific information within the annual report.-
 1
1 -
2
-
3
-
4
-
5
-
6
-
7
-
8
-
9
-
10
-
11
-
12
-
13
-
14
-
15
-
16
-
17
-
18
-
19
-
20
-
21
-
22
-
23
-
24
-
25
-
 26
26 -
 27
27 -
 28
28 -
 29
29 -
 30
30 -
 31
31 -
 32
32 -
 33
33 -
 34
34 -
 35
35 -
 36
36 -
 37
37 -
 38
38 -
 39
39 -
 40
40 -
 41
41 -
 42
42 -
 43
43 -
 44
44 -
 45
45 -
 46
46 -
47
-
48
-
49
-
50
-
51
-
52
-
53
-
54
-
55
-
56
-
57
-
58
-
59
-
60
-
61
-
62
-
63
-
64
-
65
-
66
-
67
-
68
-
69
-
70
-
71
-
72
-
73
-
74
-
75
-
76
-
77
-
78
-
79
-
80
-
81
-
82
-
83
-
84
-
85
-
86
-
87
-
88
-
89
-
90
-
91
-
92
-
93
-
94
-
95
-
96
-
97
-
98
-
99
-
100
-
101
-
102
-
103
-
104
-
105
-
106
-
107
-
108
-
109
-
110
-
111
-
112
 |
 |

34
Management’s Discussion
Xerox 2010 Annual Report
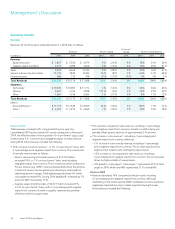
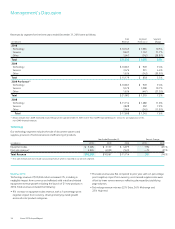
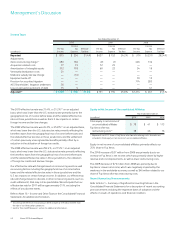
Revenues by segment for the three years ended December 31, 2010 were as follows:
Total Segment Segment
(in millions) Revenue Profit (Loss) Margin
2010
Technology $ 10,349 $ 1,085 10.5%
Services 9,637 1,132 11.7%
Other 1,647 (342) (20.8)%
Total $ 21,633 $ 1,875 8.7%
2009
Technology $ 10,067 $ 949 9.4%
Services 3,476 231 6.6%
Other 1,636 (342) (20.9)%
Total $ 15,179 $ 838 5.5%
2009 Pro-forma(1)
Technology $ 10,067 $ 949 9.4%
Services 9,379 1,008 10.7%
Other 1,636 (447) (27.3)%
Total $ 21,082 $ 1,510 7.2%
2008
Technology $ 11,714 $ 1,288 11.0%
Services 3,828 302 7.9%
Other 2,066 (245) (11.9)%
Total $ 17,608 $ 1,345 7.6%
(1)
Results include ACS’s 2009 estimated results February 6 through December 31. Refer to the “Non-GAAP Financial Measures” section for an explanation of this
non-GAAP financial measure.
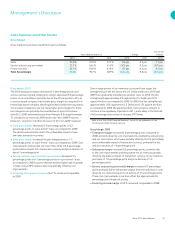
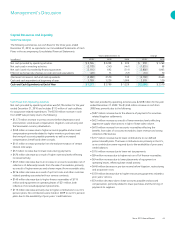
Technology
Our technology segment includes the sale of document systems and
supplies, provision of technical service and financing of products.
Year Ended December 31, Percent Change
(in millions) 2010 2009 2008 2010 2009
Equipment sales $ 3,404 $ 3,137 $ 4,079 9% (23)%
Post sale revenue(1) 6,945 6,930 7,635 —% (9)%
Total Revenue $ 10,349 $ 10,067 $ 11,714 3% (14)%
(1) Post sale revenue does not include outsourcing revenue, which is reported in our Services segment.
Post sale revenue was flat compared to prior year, with a 1-percentage
•
point negative impact from currency, as increased supplies sales were
offset by lower service revenues reflecting decreased but stabilizing
page volumes.
Technology revenue mix was 22% Entry, 56% Mid-range and
•
22% High-end.
Revenue2010
Technology revenue of $10,349 million increased 3%, including a
negligible impact from currency and reflected solid install and related
equipment revenue growth including the launch of 21 new products in
2010. Total revenues included the following:
9% increase in equipment sales revenue, with a 1-percentage point
•
negative impact from currency, driven primarily by install growth
across all color product categories.