Xerox 2010 Annual Report Download - page 3
Download and view the complete annual report
Please find page 3 of the 2010 Xerox annual report below. You can navigate through the pages in the report by either clicking on the pages listed below, or by using the keyword search tool below to find specific information within the annual report.-
 1
1 -
 2
2 -
 3
3 -
 4
4 -
 5
5 -
 6
6 -
 7
7 -
 8
8 -
 9
9 -
 10
10 -
 11
11 -
 12
12 -
 13
13 -
 14
14 -
15
-
16
-
17
-
18
-
19
-
20
-
21
-
22
-
23
-
24
-
25
-
26
-
27
-
28
-
29
-
30
-
31
-
32
-
33
-
34
-
35
-
36
-
37
-
38
-
39
-
40
-
41
-
42
-
43
-
44
-
45
-
46
-
47
-
48
-
49
-
50
-
51
-
52
-
53
-
54
-
55
-
56
-
57
-
58
-
59
-
60
-
61
-
62
-
63
-
64
-
65
-
66
-
67
-
68
-
69
-
70
-
71
-
72
-
73
-
74
-
75
-
76
-
77
-
78
-
79
-
80
-
81
-
82
-
83
-
84
-
85
-
86
-
87
-
88
-
89
-
90
-
91
-
92
-
93
-
94
-
95
-
96
-
97
-
98
-
99
-
100
-
101
-
102
-
103
-
104
-
105
-
106
-
107
-
108
-
109
-
110
-
111
-
112
 |
 |

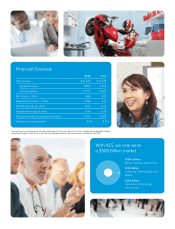
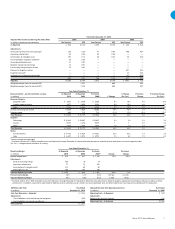
Financial Overview
* See Page 7 for the reconciliation of the difference between this financial measure that is not in compliance with Generally Accepted
Accounting Principles (GAAP) and the most directly comparable financial measure calculated in accordance with GAAP.
2010 2009
Total revenue $ 21,633 $ 15,179
Equipment sales 3,857 3,550
Annuity revenue 17,776 11,629
Net income – Xerox 606 485
Adjusted net income* – Xerox 1,296 613
Diluted earnings per share 0.43 0.55
Adjusted earnings per share* 0.94 0.70
Net cash provided by operating activities 2,726 2,208
Adjusted operating margin* 9.6% 8.6%
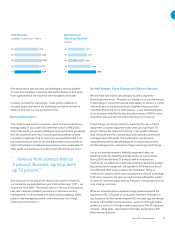
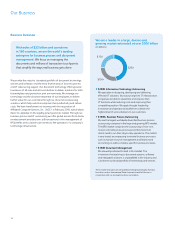
With ACS, we now serve
a $500 Billion market.
$150+ billion
Business Process Outsourcing
$130 billion
Traditional Technology-driven
Market
$250 billion
Information Technology
Outsourcing