Xerox 2010 Annual Report Download - page 104
Download and view the complete annual report
Please find page 104 of the 2010 Xerox annual report below. You can navigate through the pages in the report by either clicking on the pages listed below, or by using the keyword search tool below to find specific information within the annual report.-
 1
1 -
2
-
3
-
4
-
5
-
6
-
7
-
8
-
9
-
10
-
11
-
12
-
13
-
14
-
15
-
16
-
17
-
18
-
19
-
20
-
21
-
22
-
23
-
24
-
25
-
26
-
27
-
28
-
29
-
30
-
31
-
32
-
33
-
34
-
35
-
36
-
37
-
38
-
39
-
40
-
41
-
42
-
43
-
44
-
45
-
46
-
47
-
48
-
49
-
50
-
51
-
52
-
53
-
54
-
55
-
56
-
57
-
58
-
59
-
60
-
61
-
62
-
63
-
64
-
65
-
66
-
67
-
68
-
69
-
70
-
71
-
72
-
73
-
74
-
75
-
76
-
77
-
78
-
79
-
80
-
81
-
82
-
83
-
84
-
85
-
86
-
87
-
88
-
89
-
90
-
91
-
92
-
93
-
 94
94 -
 95
95 -
 96
96 -
 97
97 -
 98
98 -
 99
99 -
 100
100 -
 101
101 -
 102
102 -
 103
103 -
 104
104 -
 105
105 -
 106
106 -
 107
107 -
 108
108 -
 109
109 -
 110
110 -
 111
111 -
 112
112
 |
 |

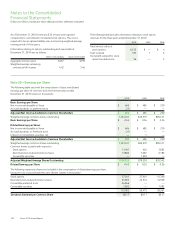
Notes to the Consolidated
Financial Statements
Dollars in millions, except per-share data and unless otherwise indicated.
102 Xerox 2010 Annual Report
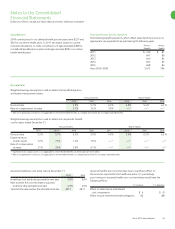
The following table provides information relating to stock option
exercises for the three years ended December 31, 2010:
2010 2009 2008
Total intrinsic value of
stock options $ 155 $ — $ 4
Cash received 183 1 6
Tax benefit realized for stock
option tax deductions 56 — 2
As of December 31, 2010, there was $35 of total unrecognized
compensation cost related to nonvested stock options. This cost is
expected to be recognized ratably over a remaining weighted-average
vesting period of three years.
Information relating to options outstanding and exercisable at
December 31, 2010 was as follows:
Options Outstanding Options Exercisable
Aggregate intrinsic value $267 $199
Weighted-average remaining
contractual life in years 4.42 3.46
Note 20 – Earnings per Share
The following table sets forth the computation of basic and diluted
earnings per share of common stock for the three years ended
December 31, 2010 (shares in thousands):
2010 2009 2008
Basic Earnings per Share:
Net income attributable to Xerox $ 606 $ 485 $ 230
Accrued dividends on preferred stock (21) — —
Adjusted Net Income Available to Common Shareholders $ 585 $ 485 $ 230
Weighted average common shares outstanding 1,323,431 869,979 885,471
Basic Earnings per Share $ 0.44 $ 0.56 $ 0.26
Diluted Earnings per Share:
Net income attributable to Xerox $ 606 $ 485 $ 230
Accrued dividends on Preferred stock (21) — —
Interest on Convertible securities, net — 1 —
Adjusted Net Income Available to Common Shareholders $ 585 $ 486 $ 230
Weighted-average common shares outstanding 1,323,431 869,979 885,471
Common shares issuable with respect to:
Stock options 13,497 462 3,885
Restricted stock and performance shares 13,800 7,087 6,186
Convertible securities — 1,992 —
Adjusted Weighted Average Shares Outstanding 1,350,728 879,520 895,542
Diluted Earnings per Share $ 0.43 $ 0.55 $ 0.26
The following represents shares not included in the computation of diluted earnings per share,
because to do so would have been anti-dilutive (shares in thousands):
Stock options 57,541 27,901 41,300
Restricted stock and performance shares 25,983 22,574 14,969
Convertible preferred stock 26,966 — —
Convertible securities 1,992 — 1,992
112,482 50,475 58,261
Dividends Declared per Common Share $0.17 $0.17 $0.17