Xerox 2010 Annual Report Download - page 88
Download and view the complete annual report
Please find page 88 of the 2010 Xerox annual report below. You can navigate through the pages in the report by either clicking on the pages listed below, or by using the keyword search tool below to find specific information within the annual report.-
 1
1 -
2
-
3
-
4
-
5
-
6
-
7
-
8
-
9
-
10
-
11
-
12
-
13
-
14
-
15
-
16
-
17
-
18
-
19
-
20
-
21
-
22
-
23
-
24
-
25
-
26
-
27
-
28
-
29
-
30
-
31
-
32
-
33
-
34
-
35
-
36
-
37
-
38
-
39
-
40
-
41
-
42
-
43
-
44
-
45
-
46
-
47
-
48
-
49
-
50
-
51
-
52
-
53
-
54
-
55
-
56
-
57
-
58
-
59
-
60
-
61
-
62
-
63
-
64
-
65
-
66
-
67
-
68
-
69
-
70
-
71
-
72
-
73
-
74
-
75
-
76
-
77
-
 78
78 -
 79
79 -
 80
80 -
 81
81 -
 82
82 -
 83
83 -
 84
84 -
 85
85 -
 86
86 -
 87
87 -
 88
88 -
 89
89 -
 90
90 -
 91
91 -
 92
92 -
 93
93 -
 94
94 -
 95
95 -
 96
96 -
 97
97 -
 98
98 -
99
-
100
-
101
-
102
-
103
-
104
-
105
-
106
-
107
-
108
-
109
-
110
-
111
-
112
 |
 |

Notes to the Consolidated
Financial Statements
Dollars in millions, except per-share data and unless otherwise indicated.
86 Xerox 2010 Annual Report
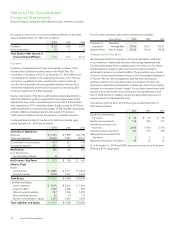
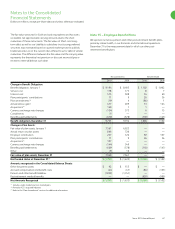
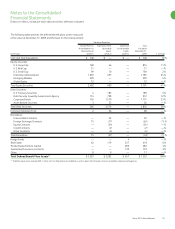
Note 14 – Fair Value of Financial Assets and Liabilities
The following table represents our assets and liabilities measured at fair
value on a recurring basis as of December 31, 2010 and 2009 and the
basis for that measurement:
Total Quoted Prices in Significant Other Significant
Fair Value Active Markets for Observable Unobservable
Measurement Identical Asset Inputs Inputs
December 31, 2010 (Level 1) (Level 2) (Level 3)
Assets:
Foreign exchange contracts-forwards $ 45 $ — $ 45 $ —
Interest rate swaps 11 — 11 —
Deferred compensation investments in cash surrender life insurance 70 — 70 —
Deferred compensation investments in mutual funds 22 — 22 —
Total $ 148 $ — $ 148 $ —
Liabilities:
Foreign exchange contracts-forwards $ 19 $ — $ 19 $ —
Deferred compensation plan liabilities 98 — 98 —
Total $ 117 $ — $ 117 $ —
Total Quoted Prices in Significant Other Significant
Fair Value Active Markets for Observable Unobservable
Measurement Identical Asset Inputs Inputs
December 31, 2009 (Level 1) (Level 2) (Level 3)
Assets:
Foreign exchange contracts – forwards $ 16 $ — $ 16 $ —
Interest rate swaps 10 — 10 —
Total $ 26 $ — $ 26 $ —
Liabilities:
Foreign exchange contracts – forwards $ 15 $ — $ 15 $ —
Interest rate swaps 9 — 9 —
Total $ 24 $ — $ 24 $ —
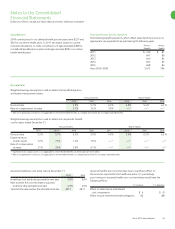
We utilized the income approach to measure fair value for our derivative
assets and liabilities. The income approach uses pricing models that rely
on market observable inputs such as yield curves, currency exchange
rates and forward prices, and therefore are classified as Level 2.
Fair value for our deferred compensation plan investments in Company-
owned life insurance is reflected at cash surrender value. Fair value for
our deferred compensation plan investments in mutual funds is based
on quoted market prices for actively traded investments similar to those
held by the plan. Fair value for deferred compensation plan liabilities
is based on the fair value of investments corresponding to employees’
investment selections, based on quoted prices for similar assets in
actively traded markets.
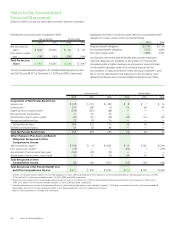
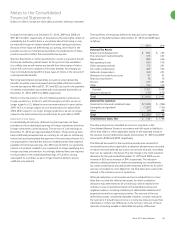
Summary of Other Financial Assets & Liabilities Not Measured
at Fair Value on a Recurring Basis
The estimated fair values of our other financial assets and liabilities not
measured at fair value on a recurring basis at December 31, 2010 and
2009 were as follows:
2010 2009
Carrying Fair Carrying Fair
Amount Value Amount Value
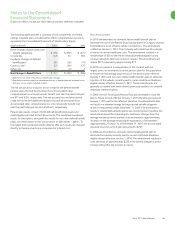
Cash and cash
equivalents $ 1,211 $ 1,211 $ 3,799 $ 3,799
Accounts receivable,
net 2,826 2,826 1,702 1,702
Short-term debt 1,370 1,396 988 1,004
Long-term debt 7,237 7,742 8,276 8,569
Liability to subsidiary
trust issuing
preferred securities 650 670 649 663