Xerox 2010 Annual Report Download - page 9
Download and view the complete annual report
Please find page 9 of the 2010 Xerox annual report below. You can navigate through the pages in the report by either clicking on the pages listed below, or by using the keyword search tool below to find specific information within the annual report.-
 1
1 -
 2
2 -
 3
3 -
 4
4 -
 5
5 -
 6
6 -
 7
7 -
 8
8 -
 9
9 -
 10
10 -
 11
11 -
 12
12 -
 13
13 -
 14
14 -
 15
15 -
 16
16 -
 17
17 -
 18
18 -
 19
19 -
 20
20 -
21
-
22
-
23
-
24
-
25
-
26
-
27
-
28
-
29
-
30
-
31
-
32
-
33
-
34
-
35
-
36
-
37
-
38
-
39
-
40
-
41
-
42
-
43
-
44
-
45
-
46
-
47
-
48
-
49
-
50
-
51
-
52
-
53
-
54
-
55
-
56
-
57
-
58
-
59
-
60
-
61
-
62
-
63
-
64
-
65
-
66
-
67
-
68
-
69
-
70
-
71
-
72
-
73
-
74
-
75
-
76
-
77
-
78
-
79
-
80
-
81
-
82
-
83
-
84
-
85
-
86
-
87
-
88
-
89
-
90
-
91
-
92
-
93
-
94
-
95
-
96
-
97
-
98
-
99
-
100
-
101
-
102
-
103
-
104
-
105
-
106
-
107
-
108
-
109
-
110
-
111
-
112
 |
 |
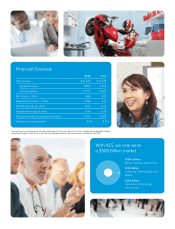
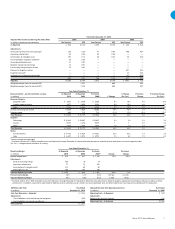
7Xerox 2010 Annual Report
Year Ended December 31,
Operating Margin: As Reported As Reported Pro-forma Pro-forma
(in millions) 2010 2009 2009(1) Change Change
Pre-tax income (loss) $ 815 $ 627 $ 1,267 30% (36)%
Adjustments
Xerox restructuring charge 483 (8) (8)
Acquisition-related costs 77 72 104
Amortization of intangible assets 312 60 60
Other expenses, net 389 285 382
Adjusted Operating Income $ 2,076 $ 1,036 $ 1,805 100% 15%
Pre-tax Income Margin 3.8% 4.1% 6.0% (0.3) pts (2.2) pts
Adjusted Operating Margin 9.6% 6.8% 8.6% 2.8 pts 1.0 pts
(1) Pro-forma reflects ACS’s 2009 estimated results from February 6 through December 31 adjusted to reflect fair-value adjustments related to property, equipment and computer software as well as customer
contract costs. In addition, adjustments were made for deferred revenue, exited businesses, certain non-recurring product sales and other material non-recurring costs associated with the acquisition.
Year Ended December 31, 2010
Adjusted Net Income and Earnings Per Share (EPS): 2010 2009 2008
(in millions, except per-share amounts) Net Income EPS Net Income EPS Net Income EPS
As Reported $ 606 $ 0.43 $ 485 $ 0.55 $ 230 $ 0.26
Adjustments:
Xerox and Fuji Xerox restructuring charges 355 0.26 41 0.05 308 0.34
Acquisition-related costs 58 0.04 49 0.06 — —
Amortization of intangible assets 194 0.14 38 0.04 35 0.04
ACS shareholders' litigation settlement 36 0.03 — — — —
Venezuela devaluation costs 21 0.02 — — — —
Medicare subsidy tax law change 16 0.01 — — — —
Loss on early extinguishment of debt 10 0.01 — — — —
Provision for litigation matters — — — — 491 0.54
Equipment write-off — — — — 24 0.03
Settlement of unrecognized tax benefits — — — — (41) (0.05)
690 0.51 128 0.15 817 0.90
Adjusted $ 1,296 $ 0.94 $ 613 $ 0.70 $ 1,047 $ 1.16
Weighted average shares for reported EPS 1,351 880 895
Weighted average shares for adjusted EPS 1,378 880 897
2010 Free Cash Flow Year Ended
(in millions) December 31, 2010
Cash from Operations – Reported $ 2,726
Adjustments:
Cost of additions to land, buildings and equipment (355)
Cost of additions to internal use software (164)
Free Cash Flow $ 2,207
Adjusted Net Cash from Operating Activities Year Ended
(in millions) December 31, 2008
Operating Cash – As Reported $ 939
Adjustments:
Payments for securities litigation 615
Operating Cash – As Adjusted $ 1,554
Year Ended December 31,
Revenue Growth – pro-forma/without currency: As Reported As Reported Pro-forma % Change Pro-forma Pro-forma Change
(in millions) 2010 2009 2009(1) % Change (Ex. Curr.) Change (Ex. Curr.)
Revenue Category
Equipment sales $ 3,857 $ 3,550 $ 3,550 9% 10% 9% 10%
Supplies, paper and other 3,377 3,096 3,234 9% 10% 4% 5%
Sales 7,234 6,646 6,784 9% 10% 7% 8%
Service, outsourcing and rentals 13,739 7,820 13,585 76% 76% 1% 1%
Finance income 660 713 713 (7)% (7)% (7)% (7)%
Total Revenues $ 21,633 $ 15,179 $ 21,082 43% 43% 3% 3%
Segment
Technology $ 10,349 $ 10,067 $ 10,067 3% 3% 3% 3%
Services 9,637 3,476 9,379 * * 3% 3%
Other 1,647 1,636 1,636 1% 1% 1% 1%
Total Revenues $ 21,633 $ 15,179 $ 21,082 43% 43% 3% 3%
Memo:
Annuity Revenue $ 17,776 $ 11,629 $ 17,532 53% 53% 1% 2%
Color $ 6,397 $ 5,972 $ 5,972 7% 8% 7% 8%
* Percent change not meaningful.
(1) Pro-forma includes ACS’s 2009 estimated results from February 6 through December 31 adjusted for deferred revenue, exited businesses and certain non-recurring product sales.
(Ex. Curr.) = change without the effects of currency