Wells Fargo 2013 Annual Report Download - page 95
Download and view the complete annual report
Please find page 95 of the 2013 Wells Fargo annual report below. You can navigate through the pages in the report by either clicking on the pages listed below, or by using the keyword search tool below to find specific information within the annual report.-
 1
1 -
2
-
3
-
4
-
5
-
6
-
7
-
8
-
9
-
10
-
11
-
12
-
13
-
14
-
15
-
16
-
17
-
18
-
19
-
20
-
21
-
22
-
23
-
24
-
25
-
26
-
27
-
28
-
29
-
30
-
31
-
32
-
33
-
34
-
35
-
36
-
37
-
38
-
39
-
40
-
41
-
42
-
43
-
44
-
45
-
46
-
47
-
48
-
49
-
50
-
51
-
52
-
53
-
54
-
55
-
56
-
57
-
58
-
59
-
60
-
61
-
62
-
63
-
64
-
65
-
66
-
67
-
68
-
69
-
70
-
71
-
72
-
73
-
74
-
75
-
76
-
77
-
78
-
79
-
80
-
81
-
82
-
83
-
84
-
 85
85 -
 86
86 -
 87
87 -
 88
88 -
 89
89 -
 90
90 -
 91
91 -
 92
92 -
 93
93 -
 94
94 -
 95
95 -
 96
96 -
 97
97 -
 98
98 -
 99
99 -
 100
100 -
 101
101 -
 102
102 -
 103
103 -
 104
104 -
 105
105 -
106
-
107
-
108
-
109
-
110
-
111
-
112
-
113
-
114
-
115
-
116
-
117
-
118
-
119
-
120
-
121
-
122
-
123
-
124
-
125
-
126
-
127
-
128
-
129
-
130
-
131
-
132
-
133
-
134
-
135
-
136
-
137
-
138
-
139
-
140
-
141
-
142
-
143
-
144
-
145
-
146
-
147
-
148
-
149
-
150
-
151
-
152
-
153
-
154
-
155
-
156
-
157
-
158
-
159
-
160
-
161
-
162
-
163
-
164
-
165
-
166
-
167
-
168
-
169
-
170
-
171
-
172
-
173
-
174
-
175
-
176
-
177
-
178
-
179
-
180
-
181
-
182
-
183
-
184
-
185
-
186
-
187
-
188
-
189
-
190
-
191
-
192
-
193
-
194
-
195
-
196
-
197
-
198
-
199
-
200
-
201
-
202
-
203
-
204
-
205
-
206
-
207
-
208
-
209
-
210
-
211
-
212
-
213
-
214
-
215
-
216
-
217
-
218
-
219
-
220
-
221
-
222
-
223
-
224
-
225
-
226
-
227
-
228
-
229
-
230
-
231
-
232
-
233
-
234
-
235
-
236
-
237
-
238
-
239
-
240
-
241
-
242
-
243
-
244
-
245
-
246
-
247
-
248
-
249
-
250
-
251
-
252
-
253
-
254
-
255
-
256
-
257
-
258
-
259
-
260
-
261
-
262
-
263
-
264
-
265
-
266
-
267
-
268
-
269
-
270
-
271
-
272
 |
 |
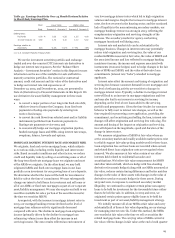
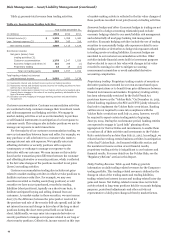
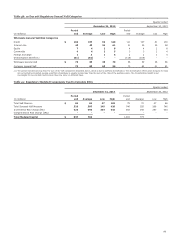
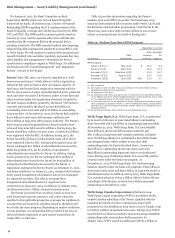
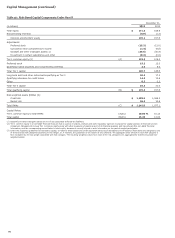
Table 48: 10-Day 99% Regulatory General VaR Categories
Quarter ended
December 31, 2013 September 30, 2013
(in millions)
Period
end Average Low High
Period
end Average Low High
Wholesale General VaR Risk Categories
Credit $ 102 107 92 120 111 107 81 130
Interest rate 40 40 24 61 51 39 23 58
Equity 7 4 2 8 4 4 2 8
Commodity 4 4 2 5 3 3 2 4
Foreign exchange 1 2 1 6 2 2 1 4
Diversification benefit (1) (81) (92) - - (115) (105) - -
Wholesale General VaR $ 73 65 49 79 56 50 26 66
Company General VaR 79 80 60 96 70 64 41 81
(1) The period-end VaR was less than the sum of the VaR components described above, which is due to portfolio diversification. The diversification effect arises because the risks
are not perfectly correlated causing a portfolio of positions to usually be less risky than the sum of the risks of the positions alone. The diversification benefit is not
meaningful for low and high metrics since they may occur on different days.
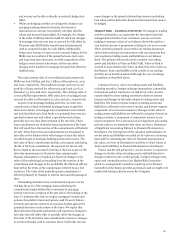
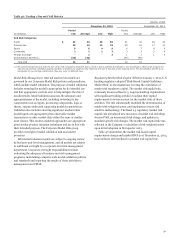
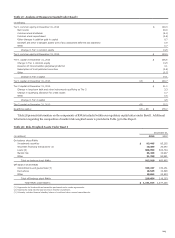
Table 49: Regulatory Modeled Components Used to Calculate RWA
Quarter ended
December 31, 2013 September 30, 2013
(in millions)
Period
end Average Low High
Period
end Average Low High
Total VaR Measure $ 84 84 67 103 75 70 47 86
Total Stressed VaR Measure 328 307 245 420 746 355 269 746
Incremental Risk Charge (IRC) 425 393 354 442 383 348 297 403
Comprehensive Risk Charge (CRC) - - - - - - - -
Total Modeled Capital $ 837 784 1,204 773
93