Wells Fargo 2013 Annual Report Download - page 57
Download and view the complete annual report
Please find page 57 of the 2013 Wells Fargo annual report below. You can navigate through the pages in the report by either clicking on the pages listed below, or by using the keyword search tool below to find specific information within the annual report.-
 1
1 -
2
-
3
-
4
-
5
-
6
-
7
-
8
-
9
-
10
-
11
-
12
-
13
-
14
-
15
-
16
-
17
-
18
-
19
-
20
-
21
-
22
-
23
-
24
-
25
-
26
-
27
-
28
-
29
-
30
-
31
-
32
-
33
-
34
-
35
-
36
-
37
-
38
-
39
-
40
-
41
-
42
-
43
-
44
-
45
-
46
-
 47
47 -
 48
48 -
 49
49 -
 50
50 -
 51
51 -
 52
52 -
 53
53 -
 54
54 -
 55
55 -
 56
56 -
 57
57 -
 58
58 -
 59
59 -
 60
60 -
 61
61 -
 62
62 -
 63
63 -
 64
64 -
 65
65 -
 66
66 -
 67
67 -
68
-
69
-
70
-
71
-
72
-
73
-
74
-
75
-
76
-
77
-
78
-
79
-
80
-
81
-
82
-
83
-
84
-
85
-
86
-
87
-
88
-
89
-
90
-
91
-
92
-
93
-
94
-
95
-
96
-
97
-
98
-
99
-
100
-
101
-
102
-
103
-
104
-
105
-
106
-
107
-
108
-
109
-
110
-
111
-
112
-
113
-
114
-
115
-
116
-
117
-
118
-
119
-
120
-
121
-
122
-
123
-
124
-
125
-
126
-
127
-
128
-
129
-
130
-
131
-
132
-
133
-
134
-
135
-
136
-
137
-
138
-
139
-
140
-
141
-
142
-
143
-
144
-
145
-
146
-
147
-
148
-
149
-
150
-
151
-
152
-
153
-
154
-
155
-
156
-
157
-
158
-
159
-
160
-
161
-
162
-
163
-
164
-
165
-
166
-
167
-
168
-
169
-
170
-
171
-
172
-
173
-
174
-
175
-
176
-
177
-
178
-
179
-
180
-
181
-
182
-
183
-
184
-
185
-
186
-
187
-
188
-
189
-
190
-
191
-
192
-
193
-
194
-
195
-
196
-
197
-
198
-
199
-
200
-
201
-
202
-
203
-
204
-
205
-
206
-
207
-
208
-
209
-
210
-
211
-
212
-
213
-
214
-
215
-
216
-
217
-
218
-
219
-
220
-
221
-
222
-
223
-
224
-
225
-
226
-
227
-
228
-
229
-
230
-
231
-
232
-
233
-
234
-
235
-
236
-
237
-
238
-
239
-
240
-
241
-
242
-
243
-
244
-
245
-
246
-
247
-
248
-
249
-
250
-
251
-
252
-
253
-
254
-
255
-
256
-
257
-
258
-
259
-
260
-
261
-
262
-
263
-
264
-
265
-
266
-
267
-
268
-
269
-
270
-
271
-
272
 |
 |

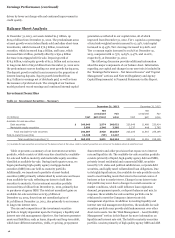
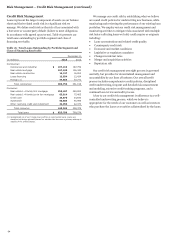
Credit Quality Overview Credit quality continued to
improve during 2013 due in part to improving economic
conditions as well as our proactive credit risk management
activities. The improvement occurred for both commercial and
consumer portfolios as evidenced by their credit metrics:
x Nonaccrual loans decreased to $3.5 billion and $12.2 billion
in our commercial and consumer portfolios, respectively, at
December 31, 2013, from $5.8 billion and $14.7 billion at
December 31, 2012. Nonaccrual loans represented 1.90% of
total loans at December 31, 2013, compared with 2.56% at
December 31, 2012.
x Net charge-offs as a percentage of average total loans
improved to 0.56% in 2013 compared with 1.17% a year ago
and were 0.06% and 0.98% in our commercial and
consumer portfolios, respectively, compared with 0.35%
and 1.84% in 2012.
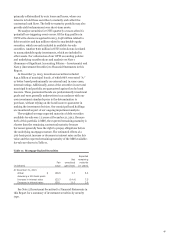
x Loans that are not government insured/guaranteed and
90 days or more past due and still accruing decreased to
$143 million and $902 million in our commercial and
consumer portfolios, respectively, at December 31, 2013,
from $303 million and $1.1 billion at December 31, 2012.
In addition to credit metric improvements we saw
improvement in various economic indicators such as home
prices that influenced our evaluation of the allowance and
provision for credit losses. Accordingly:
x Our provision for credit losses decreased to $2.3 billion in
2013 from $7.2 billion in 2012.
x The allowance for credit losses decreased to $15.0 billion at
December 31, 2013 from $17.5 billion at December 31, 2012.
Additional information on our loan portfolios and our
credit quality trends follows.
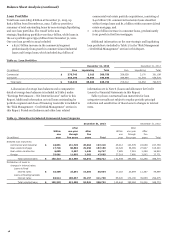
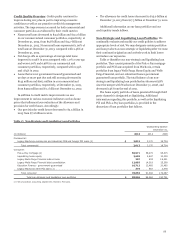
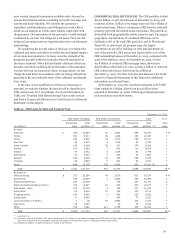
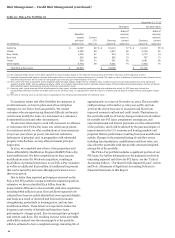
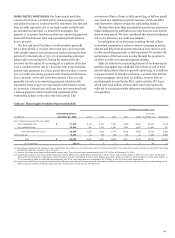
Non-Strategic and Liquidating Loan Portfolios We
continually evaluate and modify our credit policies to address
appropriate levels of risk. We may designate certain portfolios
and loan products as non-strategic or liquidating after we cease
their continued origination and actively work to limit losses
and reduce our exposures.
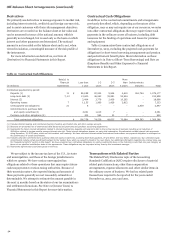
Table 17 identifies our non-strategic and liquidating loan
portfolios. They consist primarily of the Pick-a-Pay mortgage
portfolio and PCI loans acquired from Wachovia, certain
portfolios from legacy Wells Fargo Home Equity and Wells
Fargo Financial, and our education finance government
guaranteed loan portfolio. The total balance of our non-
strategic and liquidating loan portfolios has decreased 58%
since the merger with Wachovia at December 31, 2008, and
decreased 14% from the end of 2012.
The home equity portfolio of loans generated through third
party channels is designated as liquidating. Additional
information regarding this portfolio, as well as the liquidating
PCI and Pick-a-Pay loan portfolios, is provided in the
discussion of loan portfolios that follows.
Table 17: Non-Strategic and Liquidating Loan Portfolios
Outstanding balance
December 31,
(in millions) 2013 2012 2008
Commercial:
Legacy Wachovia commercial and industrial, CRE and foreign PCI loans (1) $ 2,013 3,170 18,704
Total commercial 2,013 3,170 18,704
Consumer:
Pick-a-Pay mortgage (1) 50,971 58,274 95,315
Liquidating home equity 3,695 4,647 10,309
Legacy Wells Fargo Financial indirect auto 207 830 18,221
Legacy Wells Fargo Financial debt consolidation 12,893 14,519 25,299
Education Finance - government guaranteed 10,712 12,465 20,465
Legacy Wachovia other PCI loans (1) 375 657 2,478
Total consumer 78,853 91,392 172,087
Total non-strategic and liquidating loan portfolios $ 80,866 94,562 190,791
(1) Net of purchase accounting adjustments related to PCI loans.
55