Wells Fargo 2013 Annual Report Download - page 160
Download and view the complete annual report
Please find page 160 of the 2013 Wells Fargo annual report below. You can navigate through the pages in the report by either clicking on the pages listed below, or by using the keyword search tool below to find specific information within the annual report.-
 1
1 -
2
-
3
-
4
-
5
-
6
-
7
-
8
-
9
-
10
-
11
-
12
-
13
-
14
-
15
-
16
-
17
-
18
-
19
-
20
-
21
-
22
-
23
-
24
-
25
-
26
-
27
-
28
-
29
-
30
-
31
-
32
-
33
-
34
-
35
-
36
-
37
-
38
-
39
-
40
-
41
-
42
-
43
-
44
-
45
-
46
-
47
-
48
-
49
-
50
-
51
-
52
-
53
-
54
-
55
-
56
-
57
-
58
-
59
-
60
-
61
-
62
-
63
-
64
-
65
-
66
-
67
-
68
-
69
-
70
-
71
-
72
-
73
-
74
-
75
-
76
-
77
-
78
-
79
-
80
-
81
-
82
-
83
-
84
-
85
-
86
-
87
-
88
-
89
-
90
-
91
-
92
-
93
-
94
-
95
-
96
-
97
-
98
-
99
-
100
-
101
-
102
-
103
-
104
-
105
-
106
-
107
-
108
-
109
-
110
-
111
-
112
-
113
-
114
-
115
-
116
-
117
-
118
-
119
-
120
-
121
-
122
-
123
-
124
-
125
-
126
-
127
-
128
-
129
-
130
-
131
-
132
-
133
-
134
-
135
-
136
-
137
-
138
-
139
-
140
-
141
-
142
-
143
-
144
-
145
-
146
-
147
-
148
-
149
-
 150
150 -
 151
151 -
 152
152 -
 153
153 -
 154
154 -
 155
155 -
 156
156 -
 157
157 -
 158
158 -
 159
159 -
 160
160 -
 161
161 -
 162
162 -
 163
163 -
 164
164 -
 165
165 -
 166
166 -
 167
167 -
 168
168 -
 169
169 -
 170
170 -
171
-
172
-
173
-
174
-
175
-
176
-
177
-
178
-
179
-
180
-
181
-
182
-
183
-
184
-
185
-
186
-
187
-
188
-
189
-
190
-
191
-
192
-
193
-
194
-
195
-
196
-
197
-
198
-
199
-
200
-
201
-
202
-
203
-
204
-
205
-
206
-
207
-
208
-
209
-
210
-
211
-
212
-
213
-
214
-
215
-
216
-
217
-
218
-
219
-
220
-
221
-
222
-
223
-
224
-
225
-
226
-
227
-
228
-
229
-
230
-
231
-
232
-
233
-
234
-
235
-
236
-
237
-
238
-
239
-
240
-
241
-
242
-
243
-
244
-
245
-
246
-
247
-
248
-
249
-
250
-
251
-
252
-
253
-
254
-
255
-
256
-
257
-
258
-
259
-
260
-
261
-
262
-
263
-
264
-
265
-
266
-
267
-
268
-
269
-
270
-
271
-
272
 |
 |

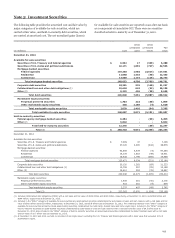
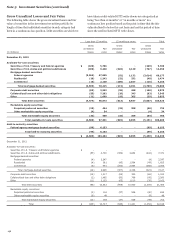
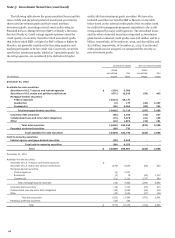
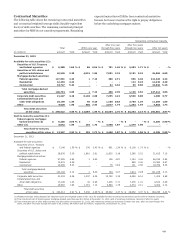
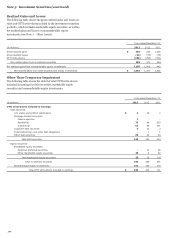
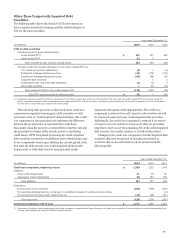
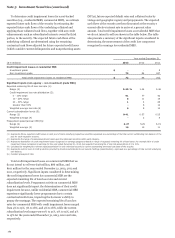
Note 5: Investment Securities (continued)
The following table shows the gross unrealized losses and fair
value of debt and perpetual preferred investment securities by
those rated investment grade and those rated less than
investment grade, according to their lowest credit rating by
Standard & Poor’s Rating Services (S&P) or Moody’s Investors
Service (Moody’s). Credit ratings express opinions about the
credit quality of a security. Securities rated investment grade,
that is those rated BBB- or higher by S&P or Baa3 or higher by
Moody’s, are generally considered by the rating agencies and
market participants to be low credit risk. Conversely, securities
rated below investment grade, labeled as “speculative grade” by
the rating agencies, are considered to be distinctively higher
credit risk than investment grade securities. We have also
included securities not rated by S&P or Moody’s in the table
below based on the internal credit grade of the securities (used
for credit risk management purposes) equivalent to the credit
rating assigned by major credit agencies. The unrealized losses
and fair value of unrated securities categorized as investment
grade based on internal credit grades were $18 million and $1.9
billion, respectively, at December 31, 2013, and $19 million and
$2.0 billion, respectively, at December 31, 2012. If an internal
credit grade was not assigned, we categorized the security as
non-investment grade.
Investment grade Non-investment grade
(in millions)
Gross
unrealized
losses
Fair
value
Gross
unrealized
losses
Fair
value
December 31, 2013
Available-for-sale securities:
Securities of U.S. Treasury and federal agencies $ (329) 5,786 - -
Securities of U.S. states and political subdivisions (671) 12,915 (56) 443
Mortgage-backed securities:
Federal agencies (3,614) 68,177 - -
Residential (2) 177 (38) 1,297
Commercial (46) 3,364 (69) 791
Total mortgage-backed securities (3,662) 71,718 (107) 2,088
Corporate debt securities (96) 2,343 (44) 627
Collateralized loan and other debt obligations (72) 7,376 (21) 169
Other (19) 1,874 (10) 181
Total debt securities (4,849) 102,012 (238) 3,508
Perpetual preferred securities (60) 732 - -
Total available-for-sale securities (4,909) 102,744 (238) 3,508
Held-to-maturity securities:
Federal agency mortgage-backed securities (99) 6,153 - -
Total held-to-maturity securities (99) 6,153 - -
Total $ (5,008) 108,897 (238) 3,508
December 31, 2012
Available-for-sale securities:
Securities of U.S. Treasury and federal agencies $ - - - -
Securities of U.S. states and political subdivisions (378) 6,839 (66) 532
Mortgage-backed securities:
Federal agencies (4) 2,247 - -
Residential (3) 78 (46) 1,747
Commercial (31) 2,110 (237) 945
Total mortgage-backed securities (38) 4,435 (283) 2,692
Corporate debt securities (19) 1,112 (50) 410
Collateralized loan and other debt obligations (49) 2,065 (46) 218
Other (49) 3,034 (27) 129
Total debt securities (533) 17,485 (472) 3,981
Perpetual preferred securities (40) 654 - -
Total $ (573) 18,139 (472) 3,981
158