Wells Fargo 2013 Annual Report Download - page 230
Download and view the complete annual report
Please find page 230 of the 2013 Wells Fargo annual report below. You can navigate through the pages in the report by either clicking on the pages listed below, or by using the keyword search tool below to find specific information within the annual report.-
 1
1 -
2
-
3
-
4
-
5
-
6
-
7
-
8
-
9
-
10
-
11
-
12
-
13
-
14
-
15
-
16
-
17
-
18
-
19
-
20
-
21
-
22
-
23
-
24
-
25
-
26
-
27
-
28
-
29
-
30
-
31
-
32
-
33
-
34
-
35
-
36
-
37
-
38
-
39
-
40
-
41
-
42
-
43
-
44
-
45
-
46
-
47
-
48
-
49
-
50
-
51
-
52
-
53
-
54
-
55
-
56
-
57
-
58
-
59
-
60
-
61
-
62
-
63
-
64
-
65
-
66
-
67
-
68
-
69
-
70
-
71
-
72
-
73
-
74
-
75
-
76
-
77
-
78
-
79
-
80
-
81
-
82
-
83
-
84
-
85
-
86
-
87
-
88
-
89
-
90
-
91
-
92
-
93
-
94
-
95
-
96
-
97
-
98
-
99
-
100
-
101
-
102
-
103
-
104
-
105
-
106
-
107
-
108
-
109
-
110
-
111
-
112
-
113
-
114
-
115
-
116
-
117
-
118
-
119
-
120
-
121
-
122
-
123
-
124
-
125
-
126
-
127
-
128
-
129
-
130
-
131
-
132
-
133
-
134
-
135
-
136
-
137
-
138
-
139
-
140
-
141
-
142
-
143
-
144
-
145
-
146
-
147
-
148
-
149
-
150
-
151
-
152
-
153
-
154
-
155
-
156
-
157
-
158
-
159
-
160
-
161
-
162
-
163
-
164
-
165
-
166
-
167
-
168
-
169
-
170
-
171
-
172
-
173
-
174
-
175
-
176
-
177
-
178
-
179
-
180
-
181
-
182
-
183
-
184
-
185
-
186
-
187
-
188
-
189
-
190
-
191
-
192
-
193
-
194
-
195
-
196
-
197
-
198
-
199
-
200
-
201
-
202
-
203
-
204
-
205
-
206
-
207
-
208
-
209
-
210
-
211
-
212
-
213
-
214
-
215
-
216
-
217
-
218
-
219
-
 220
220 -
 221
221 -
 222
222 -
 223
223 -
 224
224 -
 225
225 -
 226
226 -
 227
227 -
 228
228 -
 229
229 -
 230
230 -
 231
231 -
 232
232 -
 233
233 -
 234
234 -
 235
235 -
 236
236 -
 237
237 -
 238
238 -
 239
239 -
 240
240 -
241
-
242
-
243
-
244
-
245
-
246
-
247
-
248
-
249
-
250
-
251
-
252
-
253
-
254
-
255
-
256
-
257
-
258
-
259
-
260
-
261
-
262
-
263
-
264
-
265
-
266
-
267
-
268
-
269
-
270
-
271
-
272
 |
 |

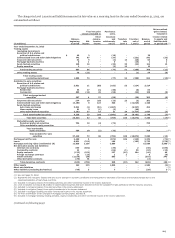
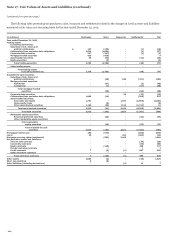
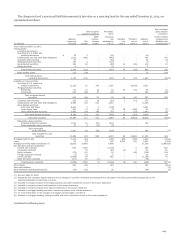
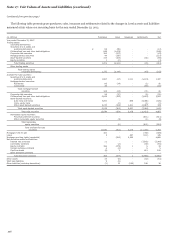
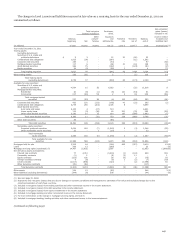
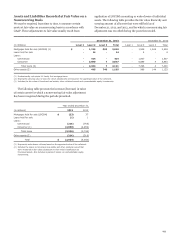
Note 17: Fair Values of Assets and Liabilities (continued)
(continued from previous page)
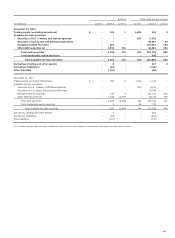
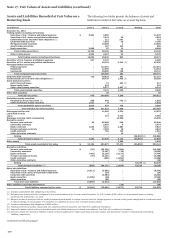
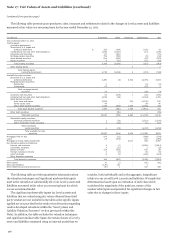
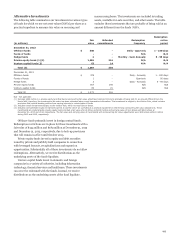
The following table presents gross purchases, sales, issuances and settlements related to the changes in Level 3 assets and liabilities
measured at fair value on a recurring basis for the year ended December 31, 2011.
(in millions) Purchases Sales Issuances Settlements Net
Year ended December 31, 2011
Trading assets
(excluding derivatives):
Securities of U.S. states and
political subdivisions $ 313 (199) - (102) 12
Collateralized loan and other debt obligations 1,054 (1,310) - (41) (297)
Corporate debt securities 80 (150) - - (70)
Mortgage-backed securities 759 (790) - (5) (36)
Asset-backed securities 516 (585) - (53) (122)
Equity securities 6 (22) - (12) (28)
Total trading securities 2,728 (3,056) - (213) (541)
Other trading assets - - 2 - 2
Total trading assets
(excluding derivatives) 2,728 (3,056) 2 (213) (539)
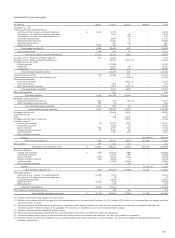
Available-for-sale securities:
Securities of U.S. states and
political subdivisions 4,280 (4) 4,723 (2,076) 6,923
Mortgage-backed securities:
Residential 3 - - (9) (6)
Commercial 21 - - (19) 2
Total mortgage-backed
securities 24 - - (28) (4)
Corporate debt securities 94 (208) 1 (72) (185)
Collateralized loan and other debt obligations 4,805 (36) - (1,044) 3,725
Asset-backed securities:
Auto loans and leases 5,918 - 333 (5,720) 531
Home equity loans 44 - - (4) 40
Other asset-backed securities 1,428 (456) 1,395 (2,186) 181
Total asset-backed securities 7,390 (456) 1,728 (7,910) 752
Other debt securities - (85) - - (85)
Total debt securities 16,593 (789) 6,452 (11,130) 11,126
Marketable equity securities:
Perpetual preferred securities 1 (13) - (1,231) (1,243)
Other marketable equity securities 3 (12) - (1) (10)
Total marketable
equity securities 4 (25) - (1,232) (1,253)
Total available-for-sale
securities 16,597 (814) 6,452 (12,362) 9,873
Mortgages held for sale 576 (21) - (659) (104)
Loans 23 (309) - (13) (299)
Mortgage servicing rights (residential) - - 4,011 (54) 3,957
Net derivative assets and liabilities:
Interest rate contracts 6 (1) - (3,419) (3,414)
Commodity contracts 7 (17) - 1 (9)
Equity contracts 123 (255) - 160 28
Foreign exchange contracts 4 (4) - (6) (6)
Credit contracts 6 (3) - (126) (123)
Other derivative contracts - - - - -
Total derivative contracts 146 (280) - (3,390) (3,524)
Other assets 10 (1) - (91) (82)
Short sale liabilities (125) 124 - 1 -
Other liabilities (excluding derivatives) (10) 1 - 317 308
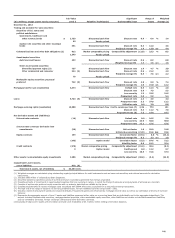
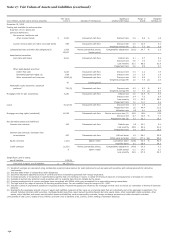
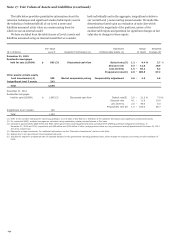
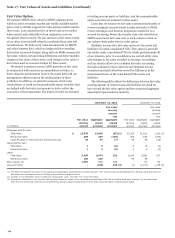
The following table provides quantitative information about
the valuation techniques and significant unobservable inputs
used in the valuation of substantially all of our Level 3 assets and
liabilities measured at fair value on a recurring basis for which
we use an internal model.
The significant unobservable inputs for Level 3 assets and
liabilities that are valued using fair values obtained from third
party vendors are not included in the table as the specific inputs
applied are not provided by the vendor (see discussion regarding
vendor-developed valuations within the “Level 3 Asset and
Liability Valuation Processes” section previously within this
Note). In addition, the table excludes the valuation techniques
and significant unobservable inputs for certain classes of Level 3
assets and liabilities measured using an internal model that we
consider, both individually and in the aggregate, insignificant
relative to our overall Level 3 assets and liabilities. We made this
determination based upon an evaluation of each class which
considered the magnitude of the positions, nature of the
unobservable inputs and potential for significant changes in fair
value due to changes in those inputs.
228