Wells Fargo 2013 Annual Report Download - page 150
Download and view the complete annual report
Please find page 150 of the 2013 Wells Fargo annual report below. You can navigate through the pages in the report by either clicking on the pages listed below, or by using the keyword search tool below to find specific information within the annual report.-
 1
1 -
2
-
3
-
4
-
5
-
6
-
7
-
8
-
9
-
10
-
11
-
12
-
13
-
14
-
15
-
16
-
17
-
18
-
19
-
20
-
21
-
22
-
23
-
24
-
25
-
26
-
27
-
28
-
29
-
30
-
31
-
32
-
33
-
34
-
35
-
36
-
37
-
38
-
39
-
40
-
41
-
42
-
43
-
44
-
45
-
46
-
47
-
48
-
49
-
50
-
51
-
52
-
53
-
54
-
55
-
56
-
57
-
58
-
59
-
60
-
61
-
62
-
63
-
64
-
65
-
66
-
67
-
68
-
69
-
70
-
71
-
72
-
73
-
74
-
75
-
76
-
77
-
78
-
79
-
80
-
81
-
82
-
83
-
84
-
85
-
86
-
87
-
88
-
89
-
90
-
91
-
92
-
93
-
94
-
95
-
96
-
97
-
98
-
99
-
100
-
101
-
102
-
103
-
104
-
105
-
106
-
107
-
108
-
109
-
110
-
111
-
112
-
113
-
114
-
115
-
116
-
117
-
118
-
119
-
120
-
121
-
122
-
123
-
124
-
125
-
126
-
127
-
128
-
129
-
130
-
131
-
132
-
133
-
134
-
135
-
136
-
137
-
138
-
139
-
 140
140 -
 141
141 -
 142
142 -
 143
143 -
 144
144 -
 145
145 -
 146
146 -
 147
147 -
 148
148 -
 149
149 -
 150
150 -
 151
151 -
 152
152 -
 153
153 -
 154
154 -
 155
155 -
 156
156 -
 157
157 -
 158
158 -
 159
159 -
 160
160 -
161
-
162
-
163
-
164
-
165
-
166
-
167
-
168
-
169
-
170
-
171
-
172
-
173
-
174
-
175
-
176
-
177
-
178
-
179
-
180
-
181
-
182
-
183
-
184
-
185
-
186
-
187
-
188
-
189
-
190
-
191
-
192
-
193
-
194
-
195
-
196
-
197
-
198
-
199
-
200
-
201
-
202
-
203
-
204
-
205
-
206
-
207
-
208
-
209
-
210
-
211
-
212
-
213
-
214
-
215
-
216
-
217
-
218
-
219
-
220
-
221
-
222
-
223
-
224
-
225
-
226
-
227
-
228
-
229
-
230
-
231
-
232
-
233
-
234
-
235
-
236
-
237
-
238
-
239
-
240
-
241
-
242
-
243
-
244
-
245
-
246
-
247
-
248
-
249
-
250
-
251
-
252
-
253
-
254
-
255
-
256
-
257
-
258
-
259
-
260
-
261
-
262
-
263
-
264
-
265
-
266
-
267
-
268
-
269
-
270
-
271
-
272
 |
 |
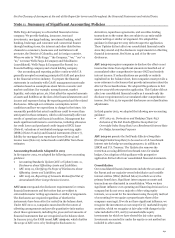
Note 1: Summary of Significant Accounting Policies (continued)
carrying amount, quantitative tests are not required. We assess
goodwill for impairment on a reporting unit level and apply
various quantitative valuation methodologies when required to
compare the estimated fair value to the carrying value of each
reporting unit. Valuation methodologies include discounted cash
flow and earnings multiple approaches. If the fair value is less
than the carrying amount, an additional test is required to
measure the amount of impairment. We recognize impairment
losses as a charge to noninterest expense (unless related to
discontinued operations) and an adjustment to the carrying
value of the goodwill asset. Subsequent reversals of goodwill
impairment are prohibited.
We amortize core deposit and other customer relationship
intangibles on an accelerated basis over useful lives not
exceeding 10 years. We review such intangibles for impairment
whenever events or changes in circumstances indicate that their
carrying amounts may not be recoverable. Impairment is
indicated if the sum of undiscounted estimated future net cash
flows is less than the carrying value of the asset. Impairment is
permanently recognized by writing down the asset to the extent
that the carrying value exceeds the estimated fair value.
Operating Lease Assets
Operating lease rental income for leased assets is recognized in
other income on a straight-line basis over the lease term. Related
depreciation expense is recorded on a straight-line basis over the
estimated useful life, considering the estimated residual value of
the leased asset. The useful life may be adjusted to the term of
the lease depending on our plans for the asset after the lease
term. On a periodic basis, leased assets are reviewed for
impairment. Impairment loss is recognized if the carrying
amount of leased assets exceeds fair value and is not recoverable.
The carrying amount of leased assets is not recoverable if it
exceeds the sum of the undiscounted cash flows expected to
result from the lease payments and the estimated residual value
upon the eventual disposition of the equipment.
Liability for Mortgage Loan Repurchase Losses
We sell residential mortgage loans to various parties, including
(1) government-sponsored entities (GSEs) Federal Home Loan
Mortgage Corporation (FHLMC) and Federal National Mortgage
Association (FNMA) who include the mortgage loans in GSE-
guaranteed mortgage securitizations, (2) SPEs that issue private
label MBS, and (3) other financial institutions that purchase
mortgage loans for investment or private label securitization. In
addition, we pool Federal Housing Administration (FHA)-
insured and Department of Veterans Affairs (VA)-guaranteed
mortgage loans, which back securities guaranteed by the
Government National Mortgage Association (GNMA).
We may be required to repurchase mortgage loans,
indemnify the securitization trust, investor or insurer, or
reimburse the securitization trust, investor or insurer for credit
losses incurred on loans (collectively “repurchase”) in the event
of a breach of specified contractual representations or warranties
that are not remedied within a period (usually 90 days or less)
after we receive notice of the breach. Our loan sale contracts to
private investors (non-GSE) typically contain an additional
provision where we would only be required to repurchase
securitized loans if a breach is deemed to have a material and
adverse effect on the value of the mortgage loan or to the
investors or interests of security holders in the mortgage loan.
We establish a mortgage repurchase liability, initially at fair
value, related to various representations and warranties that
reflect management’s estimate of losses for loans for which we
could have a repurchase obligation, whether or not we currently
service those loans, based on a combination of factors. Such
factors include default expectations, expected investor
repurchase demands (influenced by current and expected
mortgage loan file requests and mortgage insurance rescission
notices, as well as estimated levels of origination defects) and
appeals success rates (where the investor rescinds the demand
based on a cure of the defect or acknowledges that the loan
satisfies the investor’s applicable representations and
warranties), reimbursement by correspondent and other third
party originators, and projected loss severity. We continually
update our mortgage repurchase liability estimate during the life
of the loans. Although activity can vary by investor, investors
may demand repurchase at any time and there is often a lag from
the date of default to the time we receive a repurchase demand.
The majority of repurchase demands are on loans that default in
the first 24 to 36 months following origination of the mortgage
loan.
The liability for mortgage loan repurchase losses is included
in other liabilities. For additional information on our repurchase
liability, see Note 9.
Pension Accounting
We account for our defined benefit pension plans using an
actuarial model. Two principal assumptions in determining net
periodic pension cost are the discount rate and the expected long
term rate of return on plan assets.
A discount rate is used to estimate the present value of our
future pension benefit obligations. We use a consistent
methodology to determine the discount rate based upon the
yields on multiple portfolios of bonds with maturity dates that
closely match the estimated timing and amounts of the expected
benefit payments for our plans. Such portfolios are derived from
a broad-based universe of high quality corporate bonds as of the
measurement date.
Our determination of the reasonableness of our expected
long-term rate of return on plan assets is highly quantitative by
nature. We evaluate the current asset allocations and expected
returns under two sets of conditions: projected returns using
several forward-looking capital market assumptions, and
historical returns for the main asset classes dating back to 1970
or the earliest period for which historical data was readily
available for the asset classes included. Using long term
historical data allows us to capture multiple economic
environments, which we believe is relevant when using historical
returns. We place greater emphasis on the forward-looking
return and risk assumptions than on historical results. We use
the resulting projections to derive a base line expected rate of
return and risk level for the Cash Balance Plan’s prescribed asset
mix. We evaluate the portfolio based on: (1) the established
target asset allocations over short term (one-year) and longer
term (ten-year) investment horizons, and (2) the range of
148