Wells Fargo 2013 Annual Report Download - page 192
Download and view the complete annual report
Please find page 192 of the 2013 Wells Fargo annual report below. You can navigate through the pages in the report by either clicking on the pages listed below, or by using the keyword search tool below to find specific information within the annual report.-
 1
1 -
2
-
3
-
4
-
5
-
6
-
7
-
8
-
9
-
10
-
11
-
12
-
13
-
14
-
15
-
16
-
17
-
18
-
19
-
20
-
21
-
22
-
23
-
24
-
25
-
26
-
27
-
28
-
29
-
30
-
31
-
32
-
33
-
34
-
35
-
36
-
37
-
38
-
39
-
40
-
41
-
42
-
43
-
44
-
45
-
46
-
47
-
48
-
49
-
50
-
51
-
52
-
53
-
54
-
55
-
56
-
57
-
58
-
59
-
60
-
61
-
62
-
63
-
64
-
65
-
66
-
67
-
68
-
69
-
70
-
71
-
72
-
73
-
74
-
75
-
76
-
77
-
78
-
79
-
80
-
81
-
82
-
83
-
84
-
85
-
86
-
87
-
88
-
89
-
90
-
91
-
92
-
93
-
94
-
95
-
96
-
97
-
98
-
99
-
100
-
101
-
102
-
103
-
104
-
105
-
106
-
107
-
108
-
109
-
110
-
111
-
112
-
113
-
114
-
115
-
116
-
117
-
118
-
119
-
120
-
121
-
122
-
123
-
124
-
125
-
126
-
127
-
128
-
129
-
130
-
131
-
132
-
133
-
134
-
135
-
136
-
137
-
138
-
139
-
140
-
141
-
142
-
143
-
144
-
145
-
146
-
147
-
148
-
149
-
150
-
151
-
152
-
153
-
154
-
155
-
156
-
157
-
158
-
159
-
160
-
161
-
162
-
163
-
164
-
165
-
166
-
167
-
168
-
169
-
170
-
171
-
172
-
173
-
174
-
175
-
176
-
177
-
178
-
179
-
180
-
181
-
 182
182 -
 183
183 -
 184
184 -
 185
185 -
 186
186 -
 187
187 -
 188
188 -
 189
189 -
 190
190 -
 191
191 -
 192
192 -
 193
193 -
 194
194 -
 195
195 -
 196
196 -
 197
197 -
 198
198 -
 199
199 -
 200
200 -
 201
201 -
 202
202 -
203
-
204
-
205
-
206
-
207
-
208
-
209
-
210
-
211
-
212
-
213
-
214
-
215
-
216
-
217
-
218
-
219
-
220
-
221
-
222
-
223
-
224
-
225
-
226
-
227
-
228
-
229
-
230
-
231
-
232
-
233
-
234
-
235
-
236
-
237
-
238
-
239
-
240
-
241
-
242
-
243
-
244
-
245
-
246
-
247
-
248
-
249
-
250
-
251
-
252
-
253
-
254
-
255
-
256
-
257
-
258
-
259
-
260
-
261
-
262
-
263
-
264
-
265
-
266
-
267
-
268
-
269
-
270
-
271
-
272
 |
 |

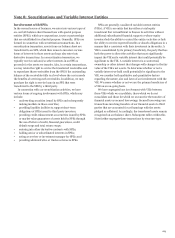
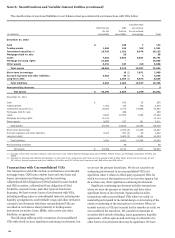
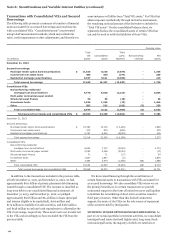
Note 8: Securitizations and Variable Interest Entities (continued)
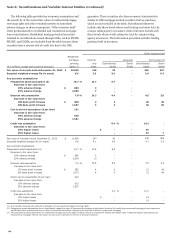
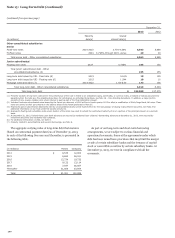
The following table provides key economic assumptions and
the sensitivity of the current fair value of residential mortgage
servicing rights and other retained interests to immediate
adverse changes in those assumptions. “Other interests held”
relate predominantly to residential and commercial mortgage
loan securitizations. Residential mortgage-backed securities
retained in securitizations issued through GSEs, such as FNMA,
FHLMC and GNMA, are excluded from the table because these
securities have a remote risk of credit loss due to the GSE
guarantee. These securities also have economic characteristics
similar to GSE mortgage-backed securities that we purchase,
which are not included in the table. Subordinated interests
include only those bonds whose credit rating was below AAA by
a major rating agency at issuance. Senior interests include only
those bonds whose credit rating was AAA by a major rating
agency at issuance. The information presented excludes trading
positions held in inventory.
Other interests held
Consumer Commercial (2)
($ in millions, except cost to service amounts)
Residential
mortgage
servicing
rights (1)
Interest-
only
strips
Subordinated
bonds
Senior
bonds
Subordinated
bonds
Senior
bonds
Fair value of interests held at December 31, 2013 $ 15,580 135 39 -283 587
Expected weighted-average life (in years) 6.4 3.8 5.9 - 3.6 6.3
Key economic assumptions:
Prepayment speed assumption (3) 10.7 % 10.7 6.7 -
Decrease in fair value from:
10% adverse change $ 864 3 - -
25% adverse change 2,065 7--
Discount rate assumption 7.8 % 18.3 4.4 - 4.5 3.6
Decrease in fair value from:
100 basis point increase $ 840 2 2 -30 30
200 basis point increase 1,607 5 4 -38 58
Cost to service assumption ($ per loan) 191
Decrease in fair value from:
10% adverse change 636
25% adverse change 1,591
Credit loss assumption 0.4 % - 14.2 -
Decrease in fair value from:
10% higher losses $ - - 29 -
25% higher losses -- 39 1
Fair value of interests held at December 31, 2012 $ 11,538 187 40 -249 982
Expected weighted-average life (in years) 4.8 4.1 5.9 -4.7 5.3
Key economic assumptions:
Prepayment speed assumption (3) 15.7 % 10.6 6.8 -
Decrease in fair value from:
10% adverse change $ 869 5 --
25% adverse change 2,038 12 --
Discount rate assumption 7.4 % 16.9 8.9 -3.5 2.2
Decrease in fair value from:
100 basis point increase $ 562 4 2 -12 43
200 basis point increase 1,073 8 4 -21 84
Cost to service assumption ($ per loan) 219
Decrease in fair value from:
10% adverse change 615
25% adverse change 1,537
Credit loss assumption 0.4 % -10.0 -
Decrease in fair value from:
10% higher losses $ - -12 -
25% higher losses --19 -
(1) See narrative following this table for a discussion of commercial mortgage servicing rights.
(2) Prepayment speed assumptions do not significantly impact the value of commercial mortgage securitization bonds as the underlying commercial mortgage loans experience
significantly lower prepayments due to certain contractual restrictions, impacting the borrower’s ability to prepay the mortgage.
(3) The prepayment speed assumption for residential mortgage servicing rights includes a blend of prepayment speeds and default rates. Prepayment speed assumptions are
influenced by mortgage interest rate inputs as well as our estimation of drivers of borrower behavior.
190